Spanish American vs Immigrants from Congo Unemployment Among Women with Children Under 18 years
COMPARE
Spanish American
Immigrants from Congo
Unemployment Among Women with Children Under 18 years
Unemployment Among Women with Children Under 18 years Comparison
Spanish Americans
Immigrants from Congo
5.8%
UNEMPLOYMENT AMONG WOMEN WITH CHILDREN UNDER 18 YEARS
3.1/ 100
METRIC RATING
233rd/ 347
METRIC RANK
6.0%
UNEMPLOYMENT AMONG WOMEN WITH CHILDREN UNDER 18 YEARS
0.4/ 100
METRIC RATING
253rd/ 347
METRIC RANK
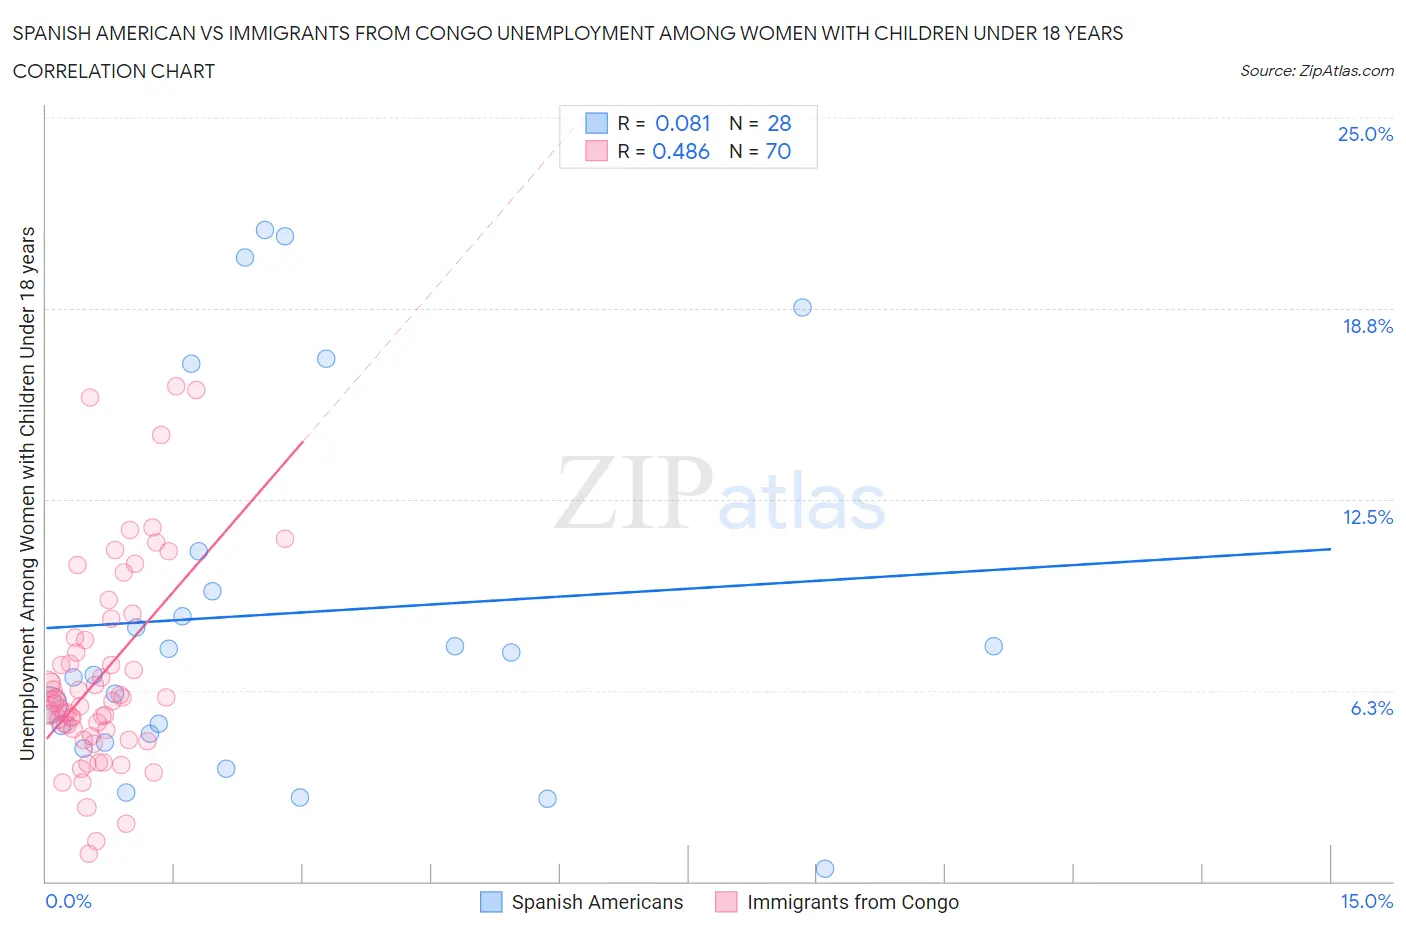
Spanish American vs Immigrants from Congo Unemployment Among Women with Children Under 18 years Correlation Chart
The statistical analysis conducted on geographies consisting of 101,927,595 people shows a slight positive correlation between the proportion of Spanish Americans and unemployment rate among women with children under the age of 18 in the United States with a correlation coefficient (R) of 0.081 and weighted average of 5.8%. Similarly, the statistical analysis conducted on geographies consisting of 91,326,387 people shows a moderate positive correlation between the proportion of Immigrants from Congo and unemployment rate among women with children under the age of 18 in the United States with a correlation coefficient (R) of 0.486 and weighted average of 6.0%, a difference of 3.3%.
Unemployment Among Women with Children Under 18 years Correlation Summary
| Measurement | Spanish American | Immigrants from Congo |
| Minimum | 0.40% | 0.90% |
| Maximum | 21.3% | 16.2% |
| Range | 20.9% | 15.3% |
| Mean | 8.8% | 6.7% |
| Median | 7.1% | 5.9% |
| Interquartile 25% (IQ1) | 4.7% | 5.0% |
| Interquartile 75% (IQ3) | 10.1% | 7.9% |
| Interquartile Range (IQR) | 5.5% | 2.9% |
| Standard Deviation (Sample) | 6.1% | 3.3% |
| Standard Deviation (Population) | 6.0% | 3.2% |
Demographics Similar to Spanish Americans and Immigrants from Congo by Unemployment Among Women with Children Under 18 years
In terms of unemployment among women with children under 18 years, the demographic groups most similar to Spanish Americans are Guamanian/Chamorro (5.8%, a difference of 0.11%), Immigrants from Middle Africa (5.8%, a difference of 0.14%), Alsatian (5.8%, a difference of 0.32%), Immigrants from Lebanon (5.8%, a difference of 0.41%), and Immigrants from Somalia (5.8%, a difference of 0.60%). Similarly, the demographic groups most similar to Immigrants from Congo are Seminole (6.0%, a difference of 0.21%), Ute (5.9%, a difference of 0.84%), Immigrants from Cabo Verde (5.9%, a difference of 0.85%), Immigrants from Cameroon (5.9%, a difference of 0.92%), and Delaware (5.9%, a difference of 1.1%).
| Demographics | Rating | Rank | Unemployment Among Women with Children Under 18 years |
| Spanish Americans | 3.1 /100 | #233 | Tragic 5.8% |
| Guamanians/Chamorros | 2.9 /100 | #234 | Tragic 5.8% |
| Immigrants | Middle Africa | 2.8 /100 | #235 | Tragic 5.8% |
| Alsatians | 2.5 /100 | #236 | Tragic 5.8% |
| Immigrants | Lebanon | 2.4 /100 | #237 | Tragic 5.8% |
| Immigrants | Somalia | 2.2 /100 | #238 | Tragic 5.8% |
| Immigrants | Sierra Leone | 2.0 /100 | #239 | Tragic 5.8% |
| Immigrants | Immigrants | 2.0 /100 | #240 | Tragic 5.8% |
| Brazilians | 1.6 /100 | #241 | Tragic 5.8% |
| Moroccans | 1.4 /100 | #242 | Tragic 5.9% |
| Immigrants | Uruguay | 1.1 /100 | #243 | Tragic 5.9% |
| Choctaw | 1.1 /100 | #244 | Tragic 5.9% |
| Ugandans | 1.1 /100 | #245 | Tragic 5.9% |
| Uruguayans | 1.0 /100 | #246 | Tragic 5.9% |
| Cape Verdeans | 1.0 /100 | #247 | Tragic 5.9% |
| Delaware | 0.8 /100 | #248 | Tragic 5.9% |
| Immigrants | Cameroon | 0.8 /100 | #249 | Tragic 5.9% |
| Immigrants | Cabo Verde | 0.7 /100 | #250 | Tragic 5.9% |
| Ute | 0.7 /100 | #251 | Tragic 5.9% |
| Seminole | 0.5 /100 | #252 | Tragic 6.0% |
| Immigrants | Congo | 0.4 /100 | #253 | Tragic 6.0% |