German vs Immigrants from Congo Householder Income Ages 25 - 44 years
COMPARE
German
Immigrants from Congo
Householder Income Ages 25 - 44 years
Householder Income Ages 25 - 44 years Comparison
Germans
Immigrants from Congo
$93,531
HOUSEHOLDER INCOME AGES 25 - 44 YEARS
36.0/ 100
METRIC RATING
184th/ 347
METRIC RANK
$72,178
HOUSEHOLDER INCOME AGES 25 - 44 YEARS
0.0/ 100
METRIC RATING
340th/ 347
METRIC RANK
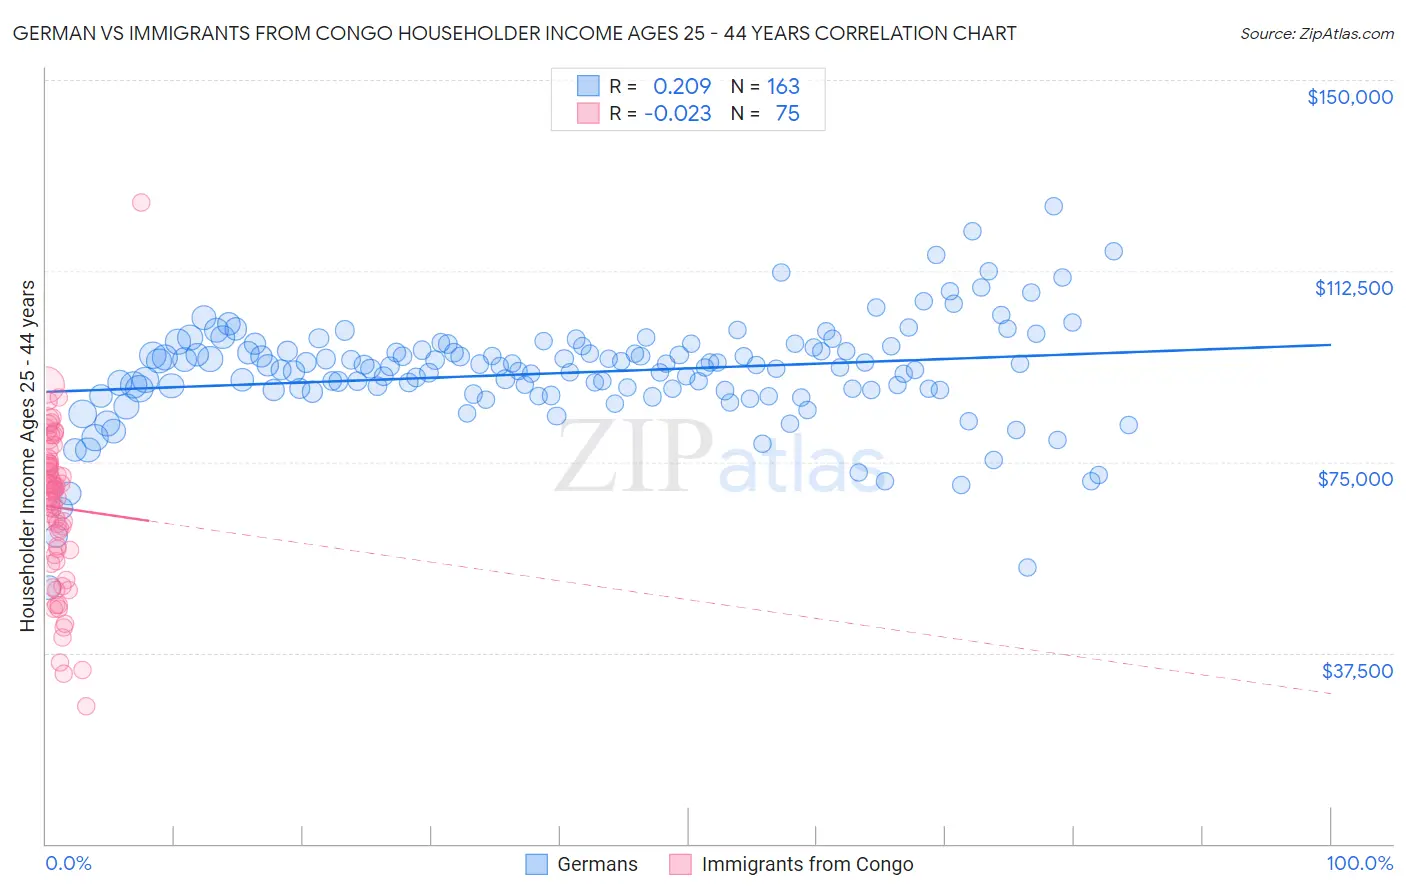
German vs Immigrants from Congo Householder Income Ages 25 - 44 years Correlation Chart
The statistical analysis conducted on geographies consisting of 573,342,679 people shows a weak positive correlation between the proportion of Germans and household income with householder between the ages 25 and 44 in the United States with a correlation coefficient (R) of 0.209 and weighted average of $93,531. Similarly, the statistical analysis conducted on geographies consisting of 92,043,798 people shows no correlation between the proportion of Immigrants from Congo and household income with householder between the ages 25 and 44 in the United States with a correlation coefficient (R) of -0.023 and weighted average of $72,178, a difference of 29.6%.
Householder Income Ages 25 - 44 years Correlation Summary
| Measurement | German | Immigrants from Congo |
| Minimum | $50,351 | $27,125 |
| Maximum | $125,193 | $125,889 |
| Range | $74,841 | $98,764 |
| Mean | $92,516 | $66,077 |
| Median | $93,847 | $69,302 |
| Interquartile 25% (IQ1) | $89,053 | $56,796 |
| Interquartile 75% (IQ3) | $97,570 | $74,591 |
| Interquartile Range (IQR) | $8,517 | $17,795 |
| Standard Deviation (Sample) | $10,480 | $15,700 |
| Standard Deviation (Population) | $10,448 | $15,595 |
Similar Demographics by Householder Income Ages 25 - 44 years
Demographics Similar to Germans by Householder Income Ages 25 - 44 years
In terms of householder income ages 25 - 44 years, the demographic groups most similar to Germans are Guamanian/Chamorro ($93,569, a difference of 0.040%), Immigrants from Eritrea ($93,466, a difference of 0.070%), Sierra Leonean ($93,435, a difference of 0.10%), Uruguayan ($93,631, a difference of 0.11%), and French ($93,665, a difference of 0.14%).
| Demographics | Rating | Rank | Householder Income Ages 25 - 44 years |
| Belgians | 45.8 /100 | #177 | Average $94,262 |
| Immigrants | South America | 42.8 /100 | #178 | Average $94,042 |
| French Canadians | 38.2 /100 | #179 | Fair $93,694 |
| French | 37.8 /100 | #180 | Fair $93,665 |
| Puget Sound Salish | 37.7 /100 | #181 | Fair $93,661 |
| Uruguayans | 37.3 /100 | #182 | Fair $93,631 |
| Guamanians/Chamorros | 36.5 /100 | #183 | Fair $93,569 |
| Germans | 36.0 /100 | #184 | Fair $93,531 |
| Immigrants | Eritrea | 35.2 /100 | #185 | Fair $93,466 |
| Sierra Leoneans | 34.8 /100 | #186 | Fair $93,435 |
| Spaniards | 34.0 /100 | #187 | Fair $93,366 |
| Immigrants | Sierra Leone | 30.9 /100 | #188 | Fair $93,115 |
| Dutch | 30.5 /100 | #189 | Fair $93,081 |
| Welsh | 30.0 /100 | #190 | Fair $93,039 |
| Tlingit-Haida | 29.4 /100 | #191 | Fair $92,987 |
Demographics Similar to Immigrants from Congo by Householder Income Ages 25 - 44 years
In terms of householder income ages 25 - 44 years, the demographic groups most similar to Immigrants from Congo are Arapaho ($71,697, a difference of 0.67%), Yuman ($72,956, a difference of 1.1%), Crow ($71,337, a difference of 1.2%), Immigrants from Yemen ($73,043, a difference of 1.2%), and Black/African American ($73,370, a difference of 1.7%).
| Demographics | Rating | Rank | Householder Income Ages 25 - 44 years |
| Hopi | 0.0 /100 | #333 | Tragic $75,002 |
| Creek | 0.0 /100 | #334 | Tragic $74,847 |
| Kiowa | 0.0 /100 | #335 | Tragic $74,776 |
| Yup'ik | 0.0 /100 | #336 | Tragic $73,688 |
| Blacks/African Americans | 0.0 /100 | #337 | Tragic $73,370 |
| Immigrants | Yemen | 0.0 /100 | #338 | Tragic $73,043 |
| Yuman | 0.0 /100 | #339 | Tragic $72,956 |
| Immigrants | Congo | 0.0 /100 | #340 | Tragic $72,178 |
| Arapaho | 0.0 /100 | #341 | Tragic $71,697 |
| Crow | 0.0 /100 | #342 | Tragic $71,337 |
| Tohono O'odham | 0.0 /100 | #343 | Tragic $69,068 |
| Pueblo | 0.0 /100 | #344 | Tragic $68,910 |
| Navajo | 0.0 /100 | #345 | Tragic $66,529 |
| Puerto Ricans | 0.0 /100 | #346 | Tragic $65,996 |
| Lumbee | 0.0 /100 | #347 | Tragic $60,305 |