Spanish American vs Czech Single Father Households
COMPARE
Spanish American
Czech
Single Father Households
Single Father Households Comparison
Spanish Americans
Czechs
2.8%
SINGLE FATHER HOUSEHOLDS
0.0/ 100
METRIC RATING
302nd/ 347
METRIC RANK
2.3%
SINGLE FATHER HOUSEHOLDS
62.5/ 100
METRIC RATING
169th/ 347
METRIC RANK
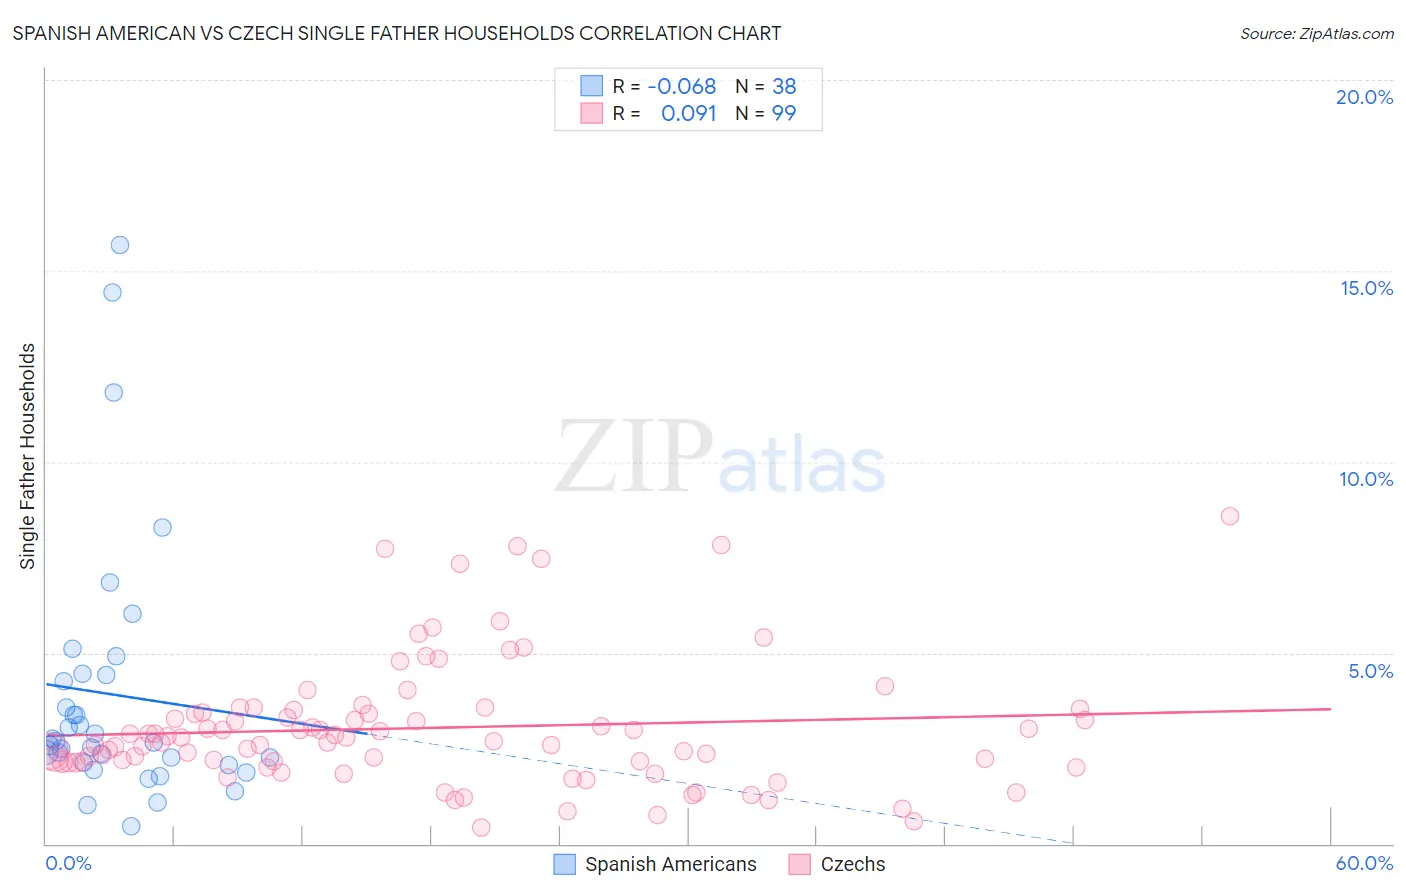
Spanish American vs Czech Single Father Households Correlation Chart
The statistical analysis conducted on geographies consisting of 102,947,079 people shows a slight negative correlation between the proportion of Spanish Americans and percentage of single father households in the United States with a correlation coefficient (R) of -0.068 and weighted average of 2.8%. Similarly, the statistical analysis conducted on geographies consisting of 477,253,750 people shows a slight positive correlation between the proportion of Czechs and percentage of single father households in the United States with a correlation coefficient (R) of 0.091 and weighted average of 2.3%, a difference of 21.2%.
Single Father Households Correlation Summary
| Measurement | Spanish American | Czech |
| Minimum | 0.47% | 0.41% |
| Maximum | 15.7% | 8.6% |
| Range | 15.2% | 8.2% |
| Mean | 3.9% | 3.0% |
| Median | 2.7% | 2.7% |
| Interquartile 25% (IQ1) | 2.1% | 2.1% |
| Interquartile 75% (IQ3) | 4.4% | 3.4% |
| Interquartile Range (IQR) | 2.3% | 1.3% |
| Standard Deviation (Sample) | 3.4% | 1.7% |
| Standard Deviation (Population) | 3.4% | 1.6% |
Similar Demographics by Single Father Households
Demographics Similar to Spanish Americans by Single Father Households
In terms of single father households, the demographic groups most similar to Spanish Americans are Immigrants from Honduras (2.8%, a difference of 0.020%), Mexican American Indian (2.8%, a difference of 0.33%), Hispanic or Latino (2.8%, a difference of 0.49%), Immigrants from Latin America (2.8%, a difference of 0.53%), and Kiowa (2.8%, a difference of 0.58%).
| Demographics | Rating | Rank | Single Father Households |
| Chickasaw | 0.0 /100 | #295 | Tragic 2.8% |
| Japanese | 0.0 /100 | #296 | Tragic 2.8% |
| Hondurans | 0.0 /100 | #297 | Tragic 2.8% |
| Cree | 0.0 /100 | #298 | Tragic 2.8% |
| Lumbee | 0.0 /100 | #299 | Tragic 2.8% |
| Kiowa | 0.0 /100 | #300 | Tragic 2.8% |
| Immigrants | Latin America | 0.0 /100 | #301 | Tragic 2.8% |
| Spanish Americans | 0.0 /100 | #302 | Tragic 2.8% |
| Immigrants | Honduras | 0.0 /100 | #303 | Tragic 2.8% |
| Mexican American Indians | 0.0 /100 | #304 | Tragic 2.8% |
| Hispanics or Latinos | 0.0 /100 | #305 | Tragic 2.8% |
| Immigrants | Azores | 0.0 /100 | #306 | Tragic 2.8% |
| Hopi | 0.0 /100 | #307 | Tragic 2.8% |
| Apache | 0.0 /100 | #308 | Tragic 2.8% |
| Central Americans | 0.0 /100 | #309 | Tragic 2.9% |
Demographics Similar to Czechs by Single Father Households
In terms of single father households, the demographic groups most similar to Czechs are Ugandan (2.3%, a difference of 0.020%), Icelander (2.3%, a difference of 0.040%), Swedish (2.3%, a difference of 0.070%), South American (2.3%, a difference of 0.14%), and Czechoslovakian (2.3%, a difference of 0.29%).
| Demographics | Rating | Rank | Single Father Households |
| Scottish | 72.8 /100 | #162 | Good 2.3% |
| Irish | 72.1 /100 | #163 | Good 2.3% |
| Pakistanis | 70.6 /100 | #164 | Good 2.3% |
| Scotch-Irish | 69.4 /100 | #165 | Good 2.3% |
| English | 68.6 /100 | #166 | Good 2.3% |
| South Americans | 64.3 /100 | #167 | Good 2.3% |
| Icelanders | 63.1 /100 | #168 | Good 2.3% |
| Czechs | 62.5 /100 | #169 | Good 2.3% |
| Ugandans | 62.2 /100 | #170 | Good 2.3% |
| Swedes | 61.6 /100 | #171 | Good 2.3% |
| Czechoslovakians | 58.9 /100 | #172 | Average 2.3% |
| Celtics | 55.4 /100 | #173 | Average 2.3% |
| Afghans | 50.0 /100 | #174 | Average 2.3% |
| Immigrants | Jamaica | 49.1 /100 | #175 | Average 2.3% |
| Danes | 48.2 /100 | #176 | Average 2.3% |