Immigrants from Morocco vs Cherokee Householder Income Ages 45 - 64 years
COMPARE
Immigrants from Morocco
Cherokee
Householder Income Ages 45 - 64 years
Householder Income Ages 45 - 64 years Comparison
Immigrants from Morocco
Cherokee
$102,015
HOUSEHOLDER INCOME AGES 45 - 64 YEARS
70.0/ 100
METRIC RATING
164th/ 347
METRIC RANK
$86,125
HOUSEHOLDER INCOME AGES 45 - 64 YEARS
0.1/ 100
METRIC RATING
290th/ 347
METRIC RANK
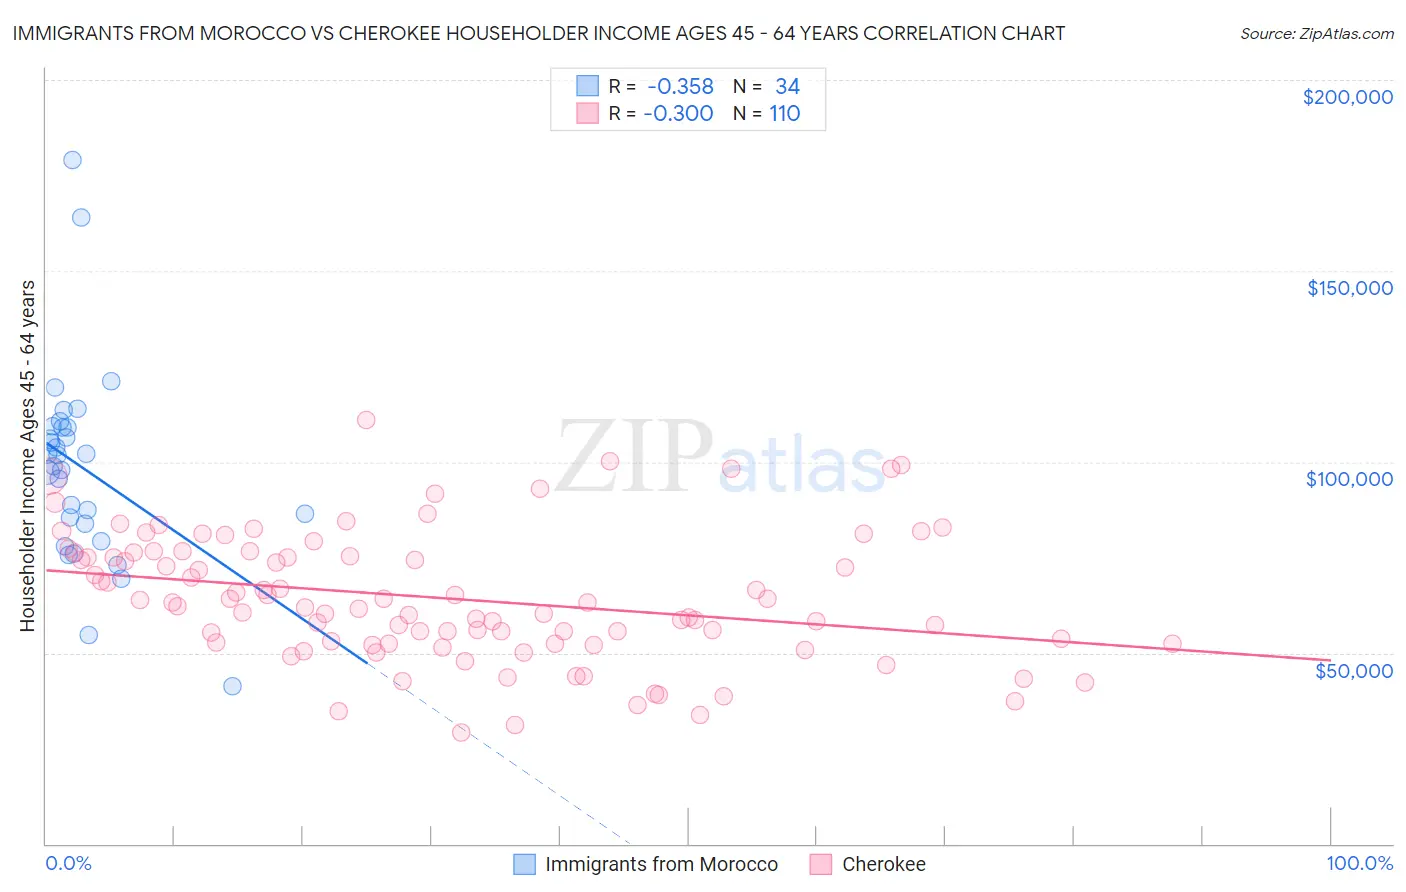
Immigrants from Morocco vs Cherokee Householder Income Ages 45 - 64 years Correlation Chart
The statistical analysis conducted on geographies consisting of 178,864,321 people shows a mild negative correlation between the proportion of Immigrants from Morocco and household income with householder between the ages 45 and 64 in the United States with a correlation coefficient (R) of -0.358 and weighted average of $102,015. Similarly, the statistical analysis conducted on geographies consisting of 491,799,921 people shows a mild negative correlation between the proportion of Cherokee and household income with householder between the ages 45 and 64 in the United States with a correlation coefficient (R) of -0.300 and weighted average of $86,125, a difference of 18.4%.
Householder Income Ages 45 - 64 years Correlation Summary
| Measurement | Immigrants from Morocco | Cherokee |
| Minimum | $41,250 | $29,177 |
| Maximum | $179,202 | $110,921 |
| Range | $137,952 | $81,743 |
| Mean | $98,384 | $64,277 |
| Median | $100,229 | $62,715 |
| Interquartile 25% (IQ1) | $83,916 | $52,500 |
| Interquartile 75% (IQ3) | $109,003 | $76,245 |
| Interquartile Range (IQR) | $25,087 | $23,745 |
| Standard Deviation (Sample) | $25,952 | $16,781 |
| Standard Deviation (Population) | $25,567 | $16,705 |
Similar Demographics by Householder Income Ages 45 - 64 years
Demographics Similar to Immigrants from Morocco by Householder Income Ages 45 - 64 years
In terms of householder income ages 45 - 64 years, the demographic groups most similar to Immigrants from Morocco are English ($102,021, a difference of 0.010%), Immigrants from Albania ($101,957, a difference of 0.060%), Scottish ($102,123, a difference of 0.11%), Immigrants from Nepal ($102,190, a difference of 0.17%), and Icelander ($102,261, a difference of 0.24%).
| Demographics | Rating | Rank | Householder Income Ages 45 - 64 years |
| Immigrants | Ethiopia | 77.3 /100 | #157 | Good $102,763 |
| Slavs | 76.1 /100 | #158 | Good $102,629 |
| Sierra Leoneans | 74.2 /100 | #159 | Good $102,427 |
| Icelanders | 72.5 /100 | #160 | Good $102,261 |
| Immigrants | Nepal | 71.8 /100 | #161 | Good $102,190 |
| Scottish | 71.1 /100 | #162 | Good $102,123 |
| English | 70.1 /100 | #163 | Good $102,021 |
| Immigrants | Morocco | 70.0 /100 | #164 | Good $102,015 |
| Immigrants | Albania | 69.4 /100 | #165 | Good $101,957 |
| Samoans | 65.3 /100 | #166 | Good $101,580 |
| Czechoslovakians | 63.0 /100 | #167 | Good $101,387 |
| South American Indians | 60.5 /100 | #168 | Good $101,171 |
| Guamanians/Chamorros | 60.5 /100 | #169 | Good $101,170 |
| Slovaks | 58.8 /100 | #170 | Average $101,029 |
| South Americans | 56.4 /100 | #171 | Average $100,837 |
Demographics Similar to Cherokee by Householder Income Ages 45 - 64 years
In terms of householder income ages 45 - 64 years, the demographic groups most similar to Cherokee are Hispanic or Latino ($86,006, a difference of 0.14%), Immigrants from Central America ($85,965, a difference of 0.19%), Cuban ($86,301, a difference of 0.20%), Immigrants from St. Vincent and the Grenadines ($86,394, a difference of 0.31%), and Bangladeshi ($86,402, a difference of 0.32%).
| Demographics | Rating | Rank | Householder Income Ages 45 - 64 years |
| Mexicans | 0.1 /100 | #283 | Tragic $86,816 |
| Central American Indians | 0.1 /100 | #284 | Tragic $86,764 |
| Blackfeet | 0.1 /100 | #285 | Tragic $86,595 |
| Immigrants | Guatemala | 0.1 /100 | #286 | Tragic $86,573 |
| Bangladeshis | 0.1 /100 | #287 | Tragic $86,402 |
| Immigrants | St. Vincent and the Grenadines | 0.1 /100 | #288 | Tragic $86,394 |
| Cubans | 0.1 /100 | #289 | Tragic $86,301 |
| Cherokee | 0.1 /100 | #290 | Tragic $86,125 |
| Hispanics or Latinos | 0.1 /100 | #291 | Tragic $86,006 |
| Immigrants | Central America | 0.1 /100 | #292 | Tragic $85,965 |
| Comanche | 0.1 /100 | #293 | Tragic $85,787 |
| British West Indians | 0.1 /100 | #294 | Tragic $85,571 |
| Immigrants | Grenada | 0.1 /100 | #295 | Tragic $85,552 |
| Immigrants | Zaire | 0.1 /100 | #296 | Tragic $85,207 |
| Fijians | 0.1 /100 | #297 | Tragic $85,187 |