Russian vs Immigrants from Ireland Per Capita Income
COMPARE
Russian
Immigrants from Ireland
Per Capita Income
Per Capita Income Comparison
Russians
Immigrants from Ireland
$53,154
PER CAPITA INCOME
100.0/ 100
METRIC RATING
26th/ 347
METRIC RANK
$56,584
PER CAPITA INCOME
100.0/ 100
METRIC RATING
9th/ 347
METRIC RANK
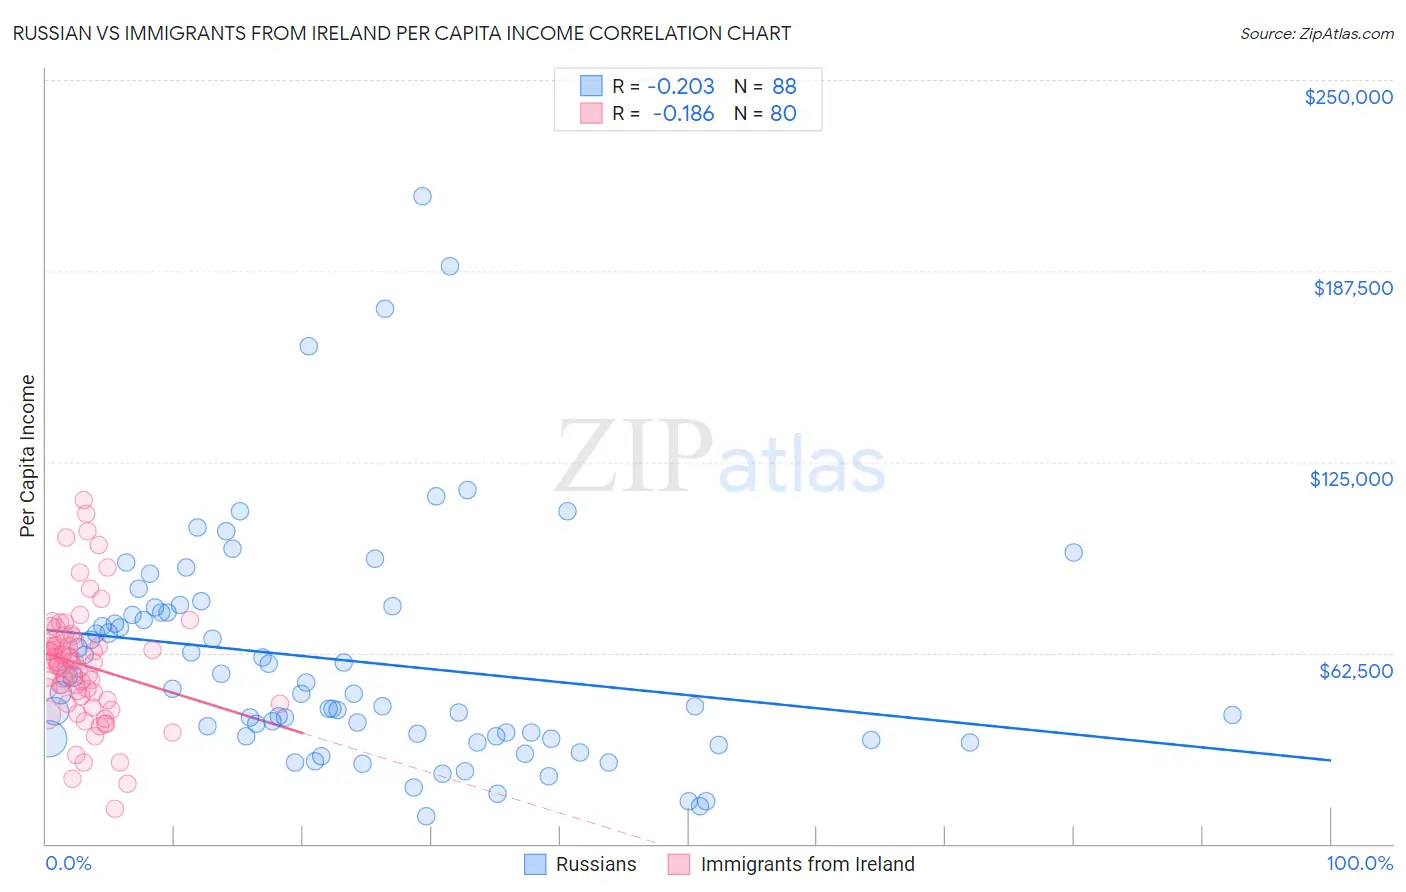
Russian vs Immigrants from Ireland Per Capita Income Correlation Chart
The statistical analysis conducted on geographies consisting of 512,304,099 people shows a weak negative correlation between the proportion of Russians and per capita income in the United States with a correlation coefficient (R) of -0.203 and weighted average of $53,154. Similarly, the statistical analysis conducted on geographies consisting of 240,778,427 people shows a poor negative correlation between the proportion of Immigrants from Ireland and per capita income in the United States with a correlation coefficient (R) of -0.186 and weighted average of $56,584, a difference of 6.5%.
Per Capita Income Correlation Summary
| Measurement | Russian | Immigrants from Ireland |
| Minimum | $9,193 | $11,481 |
| Maximum | $212,036 | $112,628 |
| Range | $202,843 | $101,147 |
| Mean | $59,937 | $58,619 |
| Median | $49,383 | $59,294 |
| Interquartile 25% (IQ1) | $34,688 | $47,629 |
| Interquartile 75% (IQ3) | $75,613 | $66,537 |
| Interquartile Range (IQR) | $40,926 | $18,908 |
| Standard Deviation (Sample) | $37,845 | $19,021 |
| Standard Deviation (Population) | $37,630 | $18,902 |
Demographics Similar to Russians and Immigrants from Ireland by Per Capita Income
In terms of per capita income, the demographic groups most similar to Russians are Immigrants from Japan ($53,359, a difference of 0.39%), Immigrants from South Central Asia ($52,660, a difference of 0.94%), Immigrants from Denmark ($53,799, a difference of 1.2%), Immigrants from Eastern Asia ($53,806, a difference of 1.2%), and Indian (Asian) ($53,874, a difference of 1.3%). Similarly, the demographic groups most similar to Immigrants from Ireland are Immigrants from Hong Kong ($56,709, a difference of 0.22%), Okinawan ($55,817, a difference of 1.4%), Immigrants from Israel ($57,384, a difference of 1.4%), Eastern European ($55,780, a difference of 1.4%), and Immigrants from Sweden ($55,582, a difference of 1.8%).
| Demographics | Rating | Rank | Per Capita Income |
| Immigrants | Israel | 100.0 /100 | #7 | Exceptional $57,384 |
| Immigrants | Hong Kong | 100.0 /100 | #8 | Exceptional $56,709 |
| Immigrants | Ireland | 100.0 /100 | #9 | Exceptional $56,584 |
| Okinawans | 100.0 /100 | #10 | Exceptional $55,817 |
| Eastern Europeans | 100.0 /100 | #11 | Exceptional $55,780 |
| Immigrants | Sweden | 100.0 /100 | #12 | Exceptional $55,582 |
| Immigrants | India | 100.0 /100 | #13 | Exceptional $55,268 |
| Immigrants | Belgium | 100.0 /100 | #14 | Exceptional $55,082 |
| Cypriots | 100.0 /100 | #15 | Exceptional $54,899 |
| Immigrants | Switzerland | 100.0 /100 | #16 | Exceptional $54,866 |
| Immigrants | France | 100.0 /100 | #17 | Exceptional $54,557 |
| Thais | 100.0 /100 | #18 | Exceptional $54,307 |
| Immigrants | China | 100.0 /100 | #19 | Exceptional $54,264 |
| Soviet Union | 100.0 /100 | #20 | Exceptional $54,202 |
| Immigrants | Northern Europe | 100.0 /100 | #21 | Exceptional $54,159 |
| Indians (Asian) | 100.0 /100 | #22 | Exceptional $53,874 |
| Immigrants | Eastern Asia | 100.0 /100 | #23 | Exceptional $53,806 |
| Immigrants | Denmark | 100.0 /100 | #24 | Exceptional $53,799 |
| Immigrants | Japan | 100.0 /100 | #25 | Exceptional $53,359 |
| Russians | 100.0 /100 | #26 | Exceptional $53,154 |
| Immigrants | South Central Asia | 100.0 /100 | #27 | Exceptional $52,660 |