Soviet Union vs Honduran Householder Income Ages 45 - 64 years
COMPARE
Soviet Union
Honduran
Householder Income Ages 45 - 64 years
Householder Income Ages 45 - 64 years Comparison
Soviet Union
Hondurans
$112,008
HOUSEHOLDER INCOME AGES 45 - 64 YEARS
99.7/ 100
METRIC RATING
58th/ 347
METRIC RANK
$84,079
HOUSEHOLDER INCOME AGES 45 - 64 YEARS
0.0/ 100
METRIC RATING
303rd/ 347
METRIC RANK
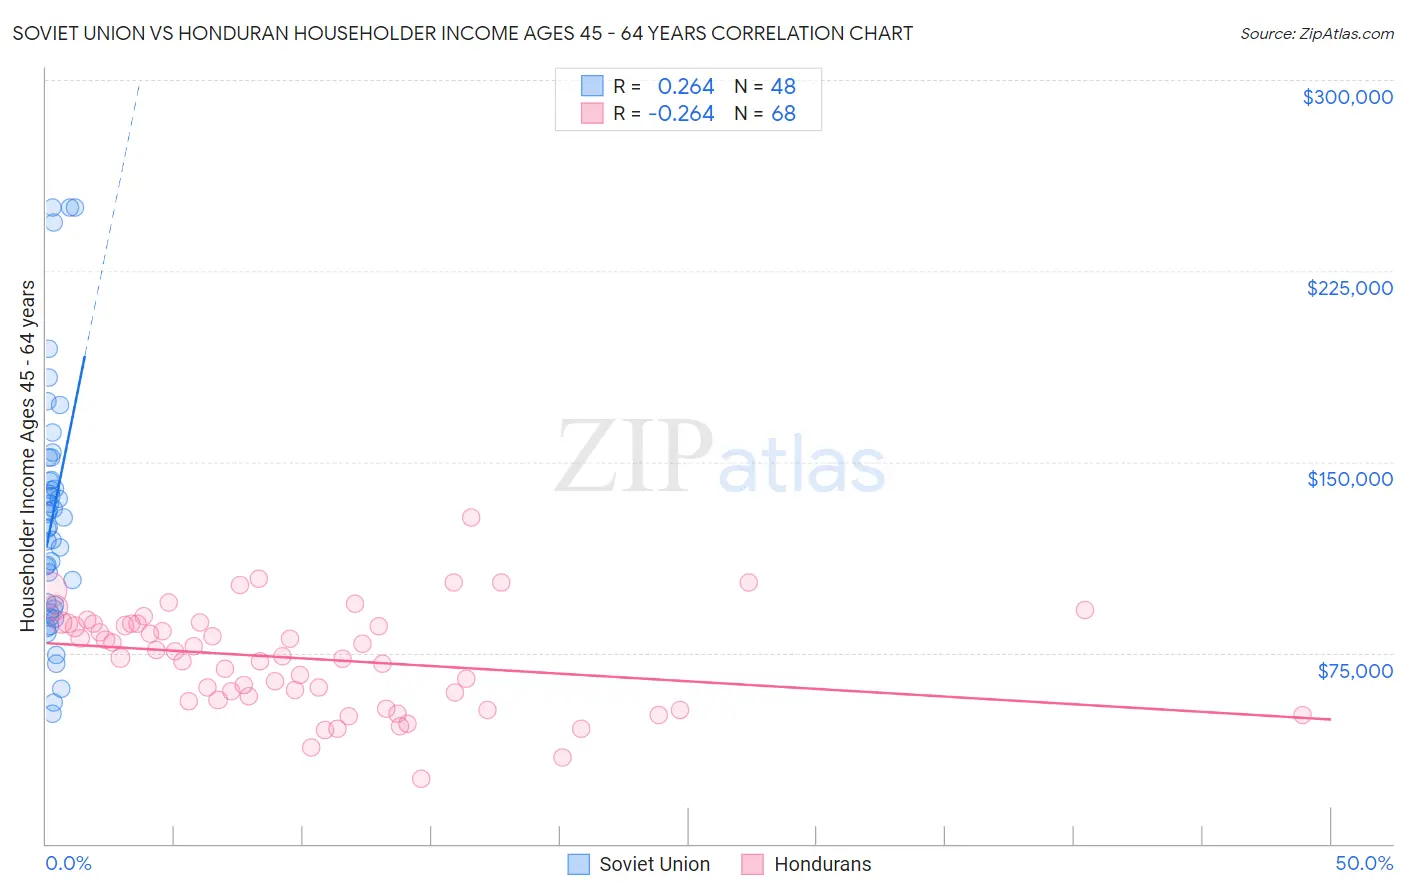
Soviet Union vs Honduran Householder Income Ages 45 - 64 years Correlation Chart
The statistical analysis conducted on geographies consisting of 43,509,359 people shows a weak positive correlation between the proportion of Soviet Union and household income with householder between the ages 45 and 64 in the United States with a correlation coefficient (R) of 0.264 and weighted average of $112,008. Similarly, the statistical analysis conducted on geographies consisting of 357,242,150 people shows a weak negative correlation between the proportion of Hondurans and household income with householder between the ages 45 and 64 in the United States with a correlation coefficient (R) of -0.264 and weighted average of $84,079, a difference of 33.2%.
Householder Income Ages 45 - 64 years Correlation Summary
| Measurement | Soviet Union | Honduran |
| Minimum | $51,149 | $25,625 |
| Maximum | $250,001 | $128,207 |
| Range | $198,852 | $102,582 |
| Mean | $129,545 | $72,746 |
| Median | $126,259 | $74,692 |
| Interquartile 25% (IQ1) | $92,904 | $57,383 |
| Interquartile 75% (IQ3) | $147,283 | $86,481 |
| Interquartile Range (IQR) | $54,378 | $29,098 |
| Standard Deviation (Sample) | $48,678 | $19,858 |
| Standard Deviation (Population) | $48,168 | $19,711 |
Similar Demographics by Householder Income Ages 45 - 64 years
Demographics Similar to Soviet Union by Householder Income Ages 45 - 64 years
In terms of householder income ages 45 - 64 years, the demographic groups most similar to Soviet Union are Immigrants from Europe ($111,984, a difference of 0.020%), Immigrants from Netherlands ($111,982, a difference of 0.020%), Immigrants from Czechoslovakia ($111,914, a difference of 0.080%), Immigrants from Scotland ($112,175, a difference of 0.15%), and Egyptian ($112,256, a difference of 0.22%).
| Demographics | Rating | Rank | Householder Income Ages 45 - 64 years |
| Immigrants | South Africa | 99.8 /100 | #51 | Exceptional $112,886 |
| Immigrants | Malaysia | 99.8 /100 | #52 | Exceptional $112,796 |
| Afghans | 99.8 /100 | #53 | Exceptional $112,676 |
| Greeks | 99.8 /100 | #54 | Exceptional $112,630 |
| Lithuanians | 99.8 /100 | #55 | Exceptional $112,484 |
| Egyptians | 99.7 /100 | #56 | Exceptional $112,256 |
| Immigrants | Scotland | 99.7 /100 | #57 | Exceptional $112,175 |
| Soviet Union | 99.7 /100 | #58 | Exceptional $112,008 |
| Immigrants | Europe | 99.7 /100 | #59 | Exceptional $111,984 |
| Immigrants | Netherlands | 99.7 /100 | #60 | Exceptional $111,982 |
| Immigrants | Czechoslovakia | 99.7 /100 | #61 | Exceptional $111,914 |
| Immigrants | Norway | 99.7 /100 | #62 | Exceptional $111,669 |
| Mongolians | 99.6 /100 | #63 | Exceptional $111,602 |
| Immigrants | Latvia | 99.6 /100 | #64 | Exceptional $111,454 |
| Immigrants | Belarus | 99.6 /100 | #65 | Exceptional $111,430 |
Demographics Similar to Hondurans by Householder Income Ages 45 - 64 years
In terms of householder income ages 45 - 64 years, the demographic groups most similar to Hondurans are Ottawa ($83,953, a difference of 0.15%), Chippewa ($83,943, a difference of 0.16%), Ute ($83,937, a difference of 0.17%), Haitian ($84,384, a difference of 0.36%), and Shoshone ($83,588, a difference of 0.59%).
| Demographics | Rating | Rank | Householder Income Ages 45 - 64 years |
| Immigrants | Zaire | 0.1 /100 | #296 | Tragic $85,207 |
| Fijians | 0.1 /100 | #297 | Tragic $85,187 |
| Africans | 0.0 /100 | #298 | Tragic $84,925 |
| Immigrants | Mexico | 0.0 /100 | #299 | Tragic $84,910 |
| Indonesians | 0.0 /100 | #300 | Tragic $84,890 |
| Potawatomi | 0.0 /100 | #301 | Tragic $84,613 |
| Haitians | 0.0 /100 | #302 | Tragic $84,384 |
| Hondurans | 0.0 /100 | #303 | Tragic $84,079 |
| Ottawa | 0.0 /100 | #304 | Tragic $83,953 |
| Chippewa | 0.0 /100 | #305 | Tragic $83,943 |
| Ute | 0.0 /100 | #306 | Tragic $83,937 |
| Shoshone | 0.0 /100 | #307 | Tragic $83,588 |
| Immigrants | Cabo Verde | 0.0 /100 | #308 | Tragic $83,542 |
| Immigrants | Dominica | 0.0 /100 | #309 | Tragic $83,311 |
| Immigrants | Haiti | 0.0 /100 | #310 | Tragic $83,257 |