Soviet Union vs Yuman Householder Income Ages 45 - 64 years
COMPARE
Soviet Union
Yuman
Householder Income Ages 45 - 64 years
Householder Income Ages 45 - 64 years Comparison
Soviet Union
Yuman
$112,008
HOUSEHOLDER INCOME AGES 45 - 64 YEARS
99.7/ 100
METRIC RATING
58th/ 347
METRIC RANK
$82,139
HOUSEHOLDER INCOME AGES 45 - 64 YEARS
0.0/ 100
METRIC RATING
321st/ 347
METRIC RANK
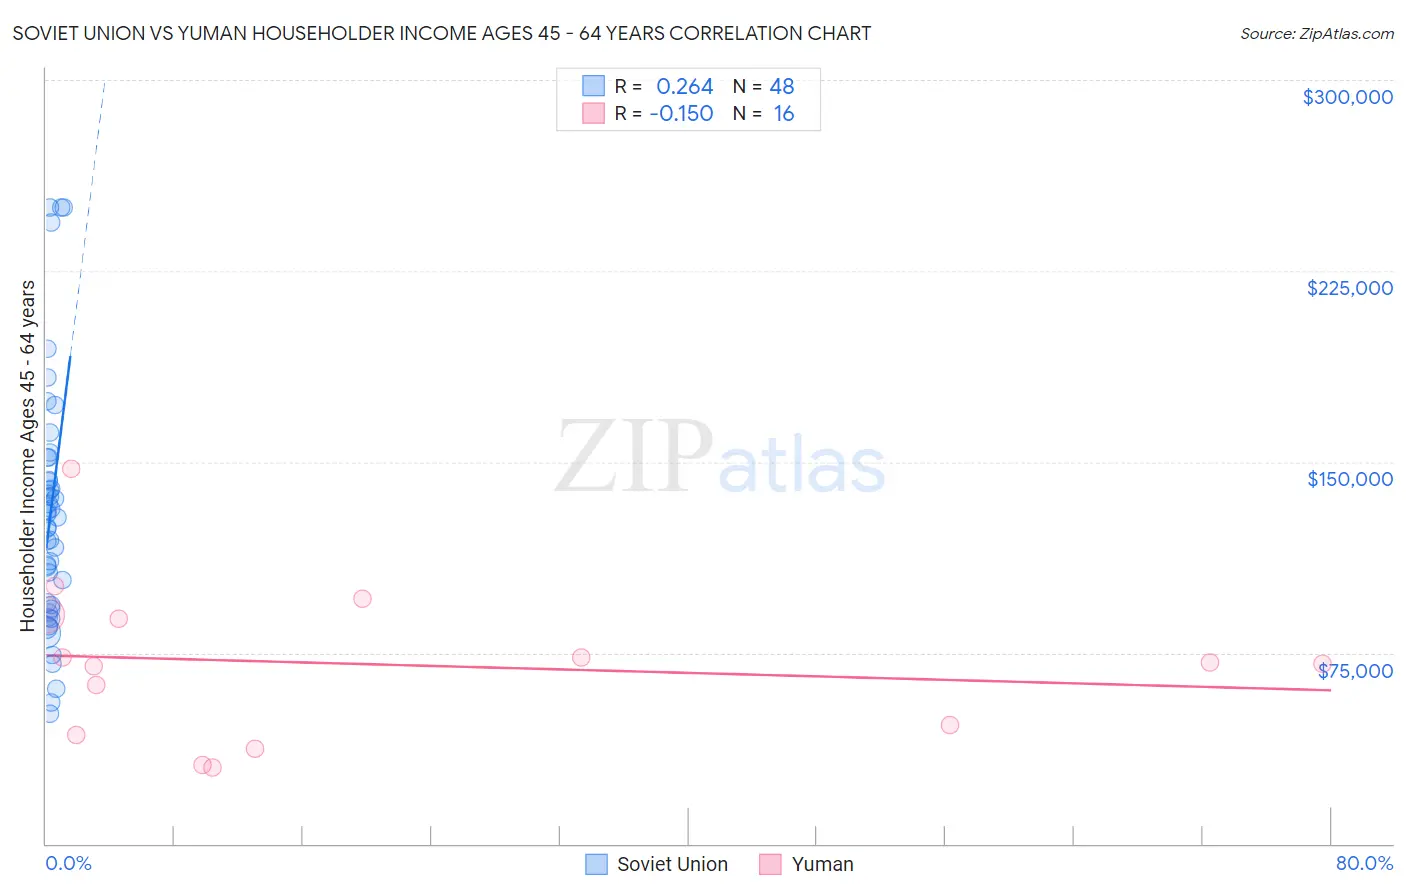
Soviet Union vs Yuman Householder Income Ages 45 - 64 years Correlation Chart
The statistical analysis conducted on geographies consisting of 43,509,359 people shows a weak positive correlation between the proportion of Soviet Union and household income with householder between the ages 45 and 64 in the United States with a correlation coefficient (R) of 0.264 and weighted average of $112,008. Similarly, the statistical analysis conducted on geographies consisting of 40,638,161 people shows a poor negative correlation between the proportion of Yuman and household income with householder between the ages 45 and 64 in the United States with a correlation coefficient (R) of -0.150 and weighted average of $82,139, a difference of 36.4%.
Householder Income Ages 45 - 64 years Correlation Summary
| Measurement | Soviet Union | Yuman |
| Minimum | $51,149 | $30,086 |
| Maximum | $250,001 | $147,152 |
| Range | $198,852 | $117,066 |
| Mean | $129,545 | $70,628 |
| Median | $126,259 | $70,888 |
| Interquartile 25% (IQ1) | $92,904 | $44,573 |
| Interquartile 75% (IQ3) | $147,283 | $88,954 |
| Interquartile Range (IQR) | $54,378 | $44,381 |
| Standard Deviation (Sample) | $48,678 | $30,431 |
| Standard Deviation (Population) | $48,168 | $29,465 |
Similar Demographics by Householder Income Ages 45 - 64 years
Demographics Similar to Soviet Union by Householder Income Ages 45 - 64 years
In terms of householder income ages 45 - 64 years, the demographic groups most similar to Soviet Union are Immigrants from Europe ($111,984, a difference of 0.020%), Immigrants from Netherlands ($111,982, a difference of 0.020%), Immigrants from Czechoslovakia ($111,914, a difference of 0.080%), Immigrants from Scotland ($112,175, a difference of 0.15%), and Egyptian ($112,256, a difference of 0.22%).
| Demographics | Rating | Rank | Householder Income Ages 45 - 64 years |
| Immigrants | South Africa | 99.8 /100 | #51 | Exceptional $112,886 |
| Immigrants | Malaysia | 99.8 /100 | #52 | Exceptional $112,796 |
| Afghans | 99.8 /100 | #53 | Exceptional $112,676 |
| Greeks | 99.8 /100 | #54 | Exceptional $112,630 |
| Lithuanians | 99.8 /100 | #55 | Exceptional $112,484 |
| Egyptians | 99.7 /100 | #56 | Exceptional $112,256 |
| Immigrants | Scotland | 99.7 /100 | #57 | Exceptional $112,175 |
| Soviet Union | 99.7 /100 | #58 | Exceptional $112,008 |
| Immigrants | Europe | 99.7 /100 | #59 | Exceptional $111,984 |
| Immigrants | Netherlands | 99.7 /100 | #60 | Exceptional $111,982 |
| Immigrants | Czechoslovakia | 99.7 /100 | #61 | Exceptional $111,914 |
| Immigrants | Norway | 99.7 /100 | #62 | Exceptional $111,669 |
| Mongolians | 99.6 /100 | #63 | Exceptional $111,602 |
| Immigrants | Latvia | 99.6 /100 | #64 | Exceptional $111,454 |
| Immigrants | Belarus | 99.6 /100 | #65 | Exceptional $111,430 |
Demographics Similar to Yuman by Householder Income Ages 45 - 64 years
In terms of householder income ages 45 - 64 years, the demographic groups most similar to Yuman are Apache ($82,184, a difference of 0.050%), Chickasaw ($82,193, a difference of 0.070%), Choctaw ($82,287, a difference of 0.18%), Colville ($82,474, a difference of 0.41%), and Immigrants from Caribbean ($82,513, a difference of 0.46%).
| Demographics | Rating | Rank | Householder Income Ages 45 - 64 years |
| Immigrants | Honduras | 0.0 /100 | #314 | Tragic $82,697 |
| Paiute | 0.0 /100 | #315 | Tragic $82,629 |
| Immigrants | Caribbean | 0.0 /100 | #316 | Tragic $82,513 |
| Colville | 0.0 /100 | #317 | Tragic $82,474 |
| Choctaw | 0.0 /100 | #318 | Tragic $82,287 |
| Chickasaw | 0.0 /100 | #319 | Tragic $82,193 |
| Apache | 0.0 /100 | #320 | Tragic $82,184 |
| Yuman | 0.0 /100 | #321 | Tragic $82,139 |
| Sioux | 0.0 /100 | #322 | Tragic $81,750 |
| Bahamians | 0.0 /100 | #323 | Tragic $81,369 |
| Yup'ik | 0.0 /100 | #324 | Tragic $81,000 |
| Immigrants | Cuba | 0.0 /100 | #325 | Tragic $80,662 |
| Dominicans | 0.0 /100 | #326 | Tragic $80,623 |
| Seminole | 0.0 /100 | #327 | Tragic $80,077 |
| Natives/Alaskans | 0.0 /100 | #328 | Tragic $79,816 |