Immigrants from Caribbean vs Italian Householder Income Over 65 years
COMPARE
Immigrants from Caribbean
Italian
Householder Income Over 65 years
Householder Income Over 65 years Comparison
Immigrants from Caribbean
Italians
$48,535
HOUSEHOLDER INCOME OVER 65 YEARS
0.0/ 100
METRIC RATING
338th/ 347
METRIC RANK
$63,885
HOUSEHOLDER INCOME OVER 65 YEARS
95.5/ 100
METRIC RATING
105th/ 347
METRIC RANK
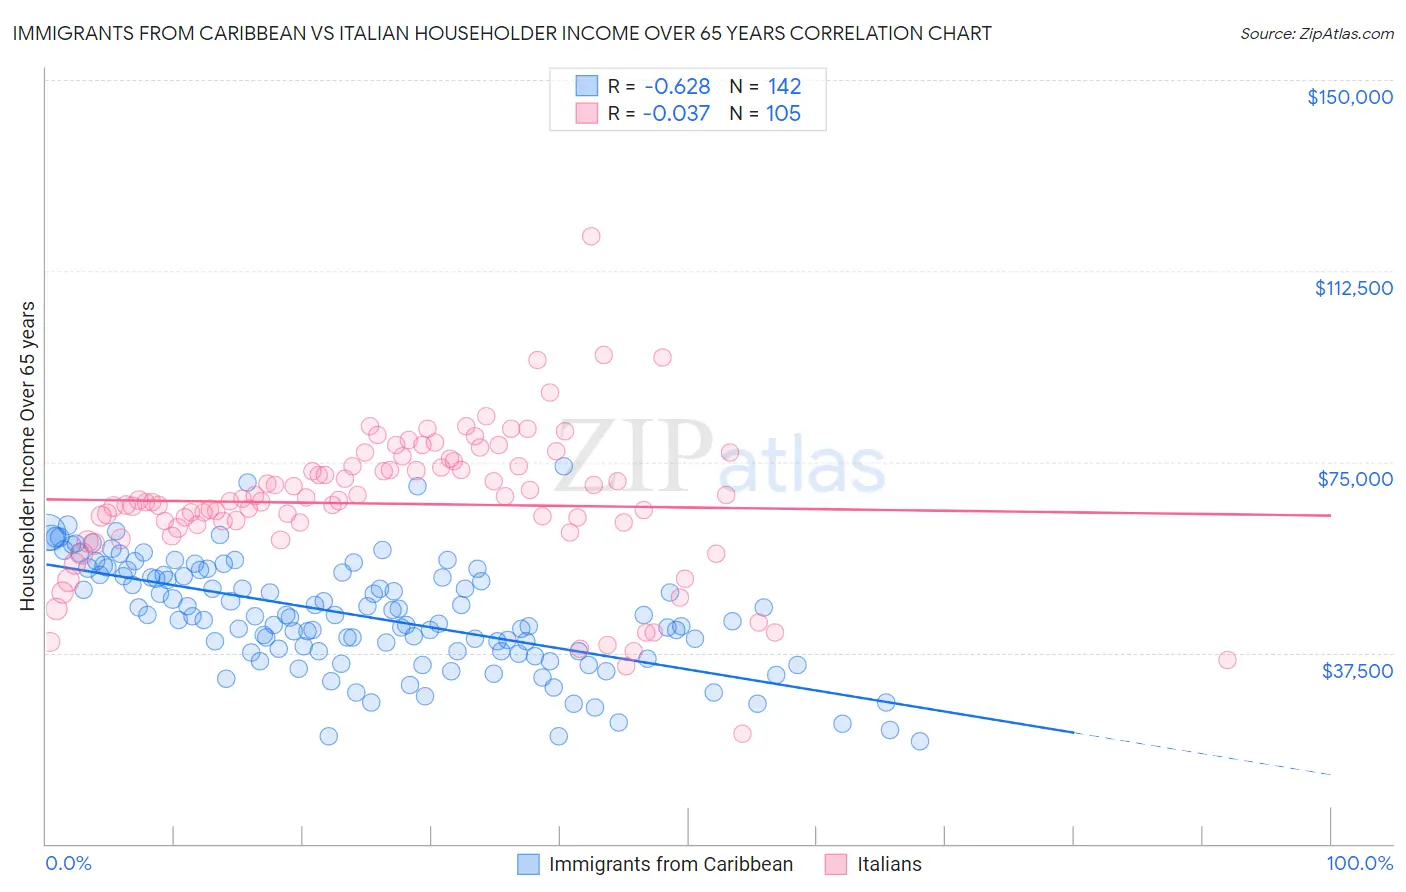
Immigrants from Caribbean vs Italian Householder Income Over 65 years Correlation Chart
The statistical analysis conducted on geographies consisting of 447,788,854 people shows a significant negative correlation between the proportion of Immigrants from Caribbean and household income with householder over the age of 65 in the United States with a correlation coefficient (R) of -0.628 and weighted average of $48,535. Similarly, the statistical analysis conducted on geographies consisting of 569,380,775 people shows no correlation between the proportion of Italians and household income with householder over the age of 65 in the United States with a correlation coefficient (R) of -0.037 and weighted average of $63,885, a difference of 31.6%.
Householder Income Over 65 years Correlation Summary
| Measurement | Immigrants from Caribbean | Italian |
| Minimum | $20,075 | $21,635 |
| Maximum | $74,155 | $119,405 |
| Range | $54,080 | $97,770 |
| Mean | $44,830 | $66,782 |
| Median | $44,697 | $67,205 |
| Interquartile 25% (IQ1) | $37,748 | $62,321 |
| Interquartile 75% (IQ3) | $52,750 | $74,713 |
| Interquartile Range (IQR) | $15,003 | $12,392 |
| Standard Deviation (Sample) | $10,716 | $14,390 |
| Standard Deviation (Population) | $10,678 | $14,321 |
Similar Demographics by Householder Income Over 65 years
Demographics Similar to Immigrants from Caribbean by Householder Income Over 65 years
In terms of householder income over 65 years, the demographic groups most similar to Immigrants from Caribbean are Tohono O'odham ($49,121, a difference of 1.2%), Cuban ($49,152, a difference of 1.3%), Crow ($49,234, a difference of 1.4%), Navajo ($47,722, a difference of 1.7%), and Immigrants from Yemen ($47,527, a difference of 2.1%).
| Demographics | Rating | Rank | Householder Income Over 65 years |
| Pima | 0.0 /100 | #331 | Tragic $50,539 |
| Dutch West Indians | 0.0 /100 | #332 | Tragic $50,475 |
| Cape Verdeans | 0.0 /100 | #333 | Tragic $50,077 |
| Immigrants | Dominica | 0.0 /100 | #334 | Tragic $50,071 |
| Crow | 0.0 /100 | #335 | Tragic $49,234 |
| Cubans | 0.0 /100 | #336 | Tragic $49,152 |
| Tohono O'odham | 0.0 /100 | #337 | Tragic $49,121 |
| Immigrants | Caribbean | 0.0 /100 | #338 | Tragic $48,535 |
| Navajo | 0.0 /100 | #339 | Tragic $47,722 |
| Immigrants | Yemen | 0.0 /100 | #340 | Tragic $47,527 |
| Dominicans | 0.0 /100 | #341 | Tragic $46,964 |
| Immigrants | Cabo Verde | 0.0 /100 | #342 | Tragic $46,654 |
| Immigrants | Dominican Republic | 0.0 /100 | #343 | Tragic $45,758 |
| Houma | 0.0 /100 | #344 | Tragic $44,822 |
| Immigrants | Cuba | 0.0 /100 | #345 | Tragic $44,735 |
Demographics Similar to Italians by Householder Income Over 65 years
In terms of householder income over 65 years, the demographic groups most similar to Italians are Immigrants from Argentina ($63,885, a difference of 0.0%), Immigrants from Cameroon ($63,907, a difference of 0.030%), Pakistani ($63,844, a difference of 0.060%), British ($63,940, a difference of 0.080%), and Chilean ($63,957, a difference of 0.11%).
| Demographics | Rating | Rank | Householder Income Over 65 years |
| Romanians | 96.5 /100 | #98 | Exceptional $64,142 |
| Assyrians/Chaldeans/Syriacs | 96.4 /100 | #99 | Exceptional $64,108 |
| Immigrants | South Eastern Asia | 96.3 /100 | #100 | Exceptional $64,089 |
| Immigrants | Italy | 96.2 /100 | #101 | Exceptional $64,065 |
| Chileans | 95.8 /100 | #102 | Exceptional $63,957 |
| British | 95.7 /100 | #103 | Exceptional $63,940 |
| Immigrants | Cameroon | 95.6 /100 | #104 | Exceptional $63,907 |
| Italians | 95.5 /100 | #105 | Exceptional $63,885 |
| Immigrants | Argentina | 95.5 /100 | #106 | Exceptional $63,885 |
| Pakistanis | 95.3 /100 | #107 | Exceptional $63,844 |
| Palestinians | 95.1 /100 | #108 | Exceptional $63,800 |
| Europeans | 95.0 /100 | #109 | Exceptional $63,779 |
| Immigrants | Zimbabwe | 94.3 /100 | #110 | Exceptional $63,643 |
| Immigrants | Spain | 93.7 /100 | #111 | Exceptional $63,540 |
| Syrians | 93.4 /100 | #112 | Exceptional $63,494 |