Soviet Union vs Maltese Householder Income Ages 25 - 44 years
COMPARE
Soviet Union
Maltese
Householder Income Ages 25 - 44 years
Householder Income Ages 25 - 44 years Comparison
Soviet Union
Maltese
$108,457
HOUSEHOLDER INCOME AGES 25 - 44 YEARS
100.0/ 100
METRIC RATING
38th/ 347
METRIC RANK
$110,064
HOUSEHOLDER INCOME AGES 25 - 44 YEARS
100.0/ 100
METRIC RATING
31st/ 347
METRIC RANK
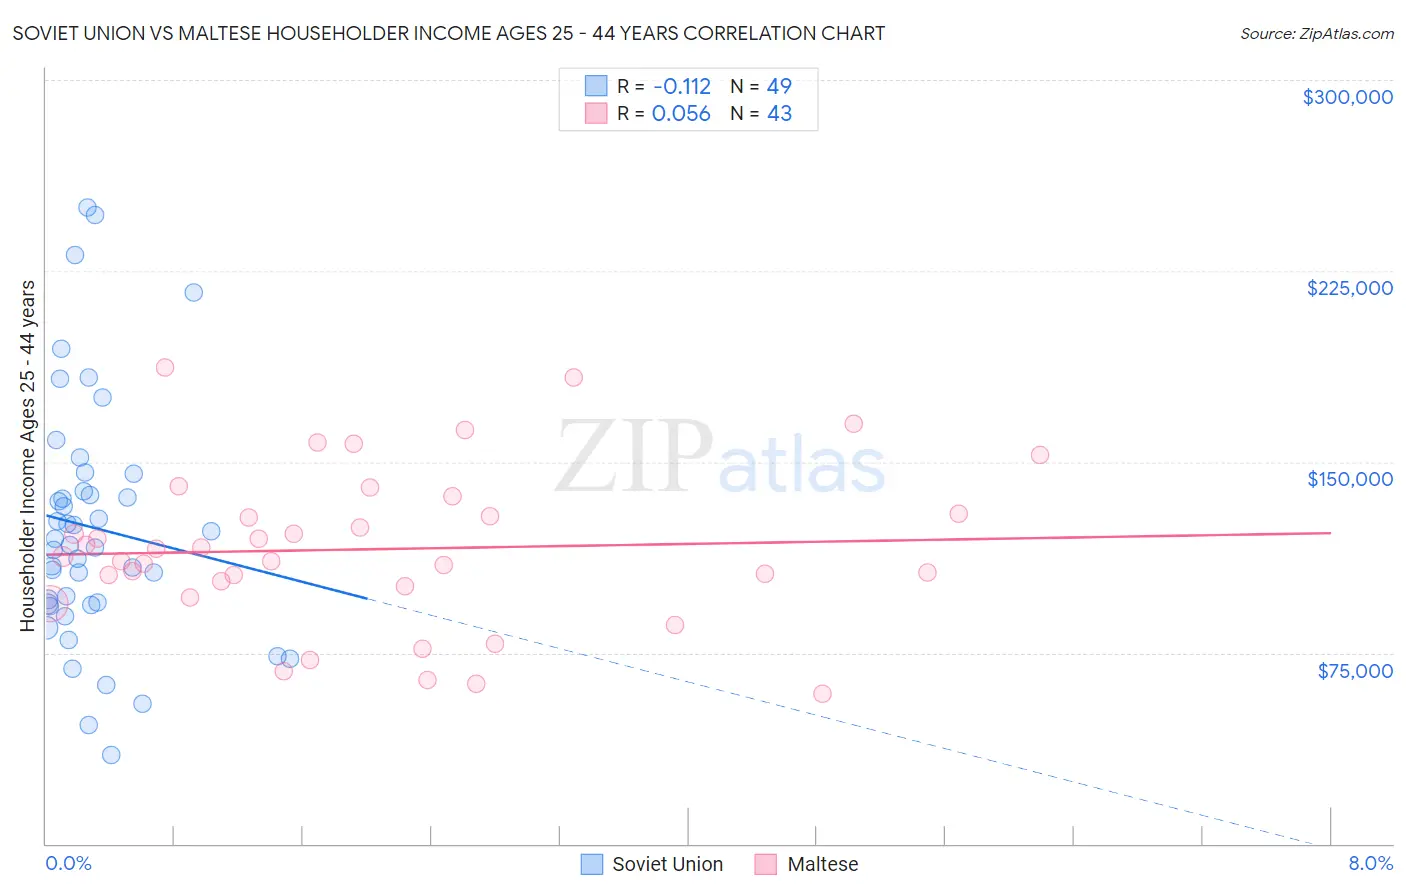
Soviet Union vs Maltese Householder Income Ages 25 - 44 years Correlation Chart
The statistical analysis conducted on geographies consisting of 43,505,949 people shows a poor negative correlation between the proportion of Soviet Union and household income with householder between the ages 25 and 44 in the United States with a correlation coefficient (R) of -0.112 and weighted average of $108,457. Similarly, the statistical analysis conducted on geographies consisting of 126,133,875 people shows a slight positive correlation between the proportion of Maltese and household income with householder between the ages 25 and 44 in the United States with a correlation coefficient (R) of 0.056 and weighted average of $110,064, a difference of 1.5%.
Householder Income Ages 25 - 44 years Correlation Summary
| Measurement | Soviet Union | Maltese |
| Minimum | $34,886 | $58,867 |
| Maximum | $250,001 | $186,969 |
| Range | $215,115 | $128,102 |
| Mean | $124,105 | $115,666 |
| Median | $117,252 | $112,847 |
| Interquartile 25% (IQ1) | $94,073 | $101,168 |
| Interquartile 75% (IQ3) | $141,816 | $129,763 |
| Interquartile Range (IQR) | $47,743 | $28,595 |
| Standard Deviation (Sample) | $48,204 | $30,812 |
| Standard Deviation (Population) | $47,710 | $30,451 |
Demographics Similar to Soviet Union and Maltese by Householder Income Ages 25 - 44 years
In terms of householder income ages 25 - 44 years, the demographic groups most similar to Soviet Union are Immigrants from France ($108,257, a difference of 0.18%), Immigrants from Russia ($108,751, a difference of 0.27%), Immigrants from Lithuania ($108,149, a difference of 0.29%), Immigrants from Bolivia ($108,128, a difference of 0.30%), and Latvian ($108,926, a difference of 0.43%). Similarly, the demographic groups most similar to Maltese are Immigrants from Greece ($110,103, a difference of 0.040%), Turkish ($110,318, a difference of 0.23%), Immigrants from Denmark ($110,363, a difference of 0.27%), Immigrants from Sri Lanka ($109,741, a difference of 0.29%), and Russian ($110,398, a difference of 0.30%).
| Demographics | Rating | Rank | Householder Income Ages 25 - 44 years |
| Immigrants | Sweden | 100.0 /100 | #24 | Exceptional $112,010 |
| Immigrants | Northern Europe | 100.0 /100 | #25 | Exceptional $111,676 |
| Immigrants | Asia | 100.0 /100 | #26 | Exceptional $110,787 |
| Russians | 100.0 /100 | #27 | Exceptional $110,398 |
| Immigrants | Denmark | 100.0 /100 | #28 | Exceptional $110,363 |
| Turks | 100.0 /100 | #29 | Exceptional $110,318 |
| Immigrants | Greece | 100.0 /100 | #30 | Exceptional $110,103 |
| Maltese | 100.0 /100 | #31 | Exceptional $110,064 |
| Immigrants | Sri Lanka | 100.0 /100 | #32 | Exceptional $109,741 |
| Bhutanese | 100.0 /100 | #33 | Exceptional $109,520 |
| Bolivians | 100.0 /100 | #34 | Exceptional $109,372 |
| Immigrants | Switzerland | 100.0 /100 | #35 | Exceptional $109,185 |
| Latvians | 100.0 /100 | #36 | Exceptional $108,926 |
| Immigrants | Russia | 100.0 /100 | #37 | Exceptional $108,751 |
| Soviet Union | 100.0 /100 | #38 | Exceptional $108,457 |
| Immigrants | France | 99.9 /100 | #39 | Exceptional $108,257 |
| Immigrants | Lithuania | 99.9 /100 | #40 | Exceptional $108,149 |
| Immigrants | Bolivia | 99.9 /100 | #41 | Exceptional $108,128 |
| Australians | 99.9 /100 | #42 | Exceptional $107,912 |
| Immigrants | Malaysia | 99.9 /100 | #43 | Exceptional $107,650 |
| Immigrants | Indonesia | 99.9 /100 | #44 | Exceptional $107,627 |