Soviet Union vs Immigrants from Romania 6th Grade
COMPARE
Soviet Union
Immigrants from Romania
6th Grade
6th Grade Comparison
Soviet Union
Immigrants from Romania
97.2%
6TH GRADE
71.5/ 100
METRIC RATING
154th/ 347
METRIC RANK
97.3%
6TH GRADE
92.0/ 100
METRIC RATING
128th/ 347
METRIC RANK
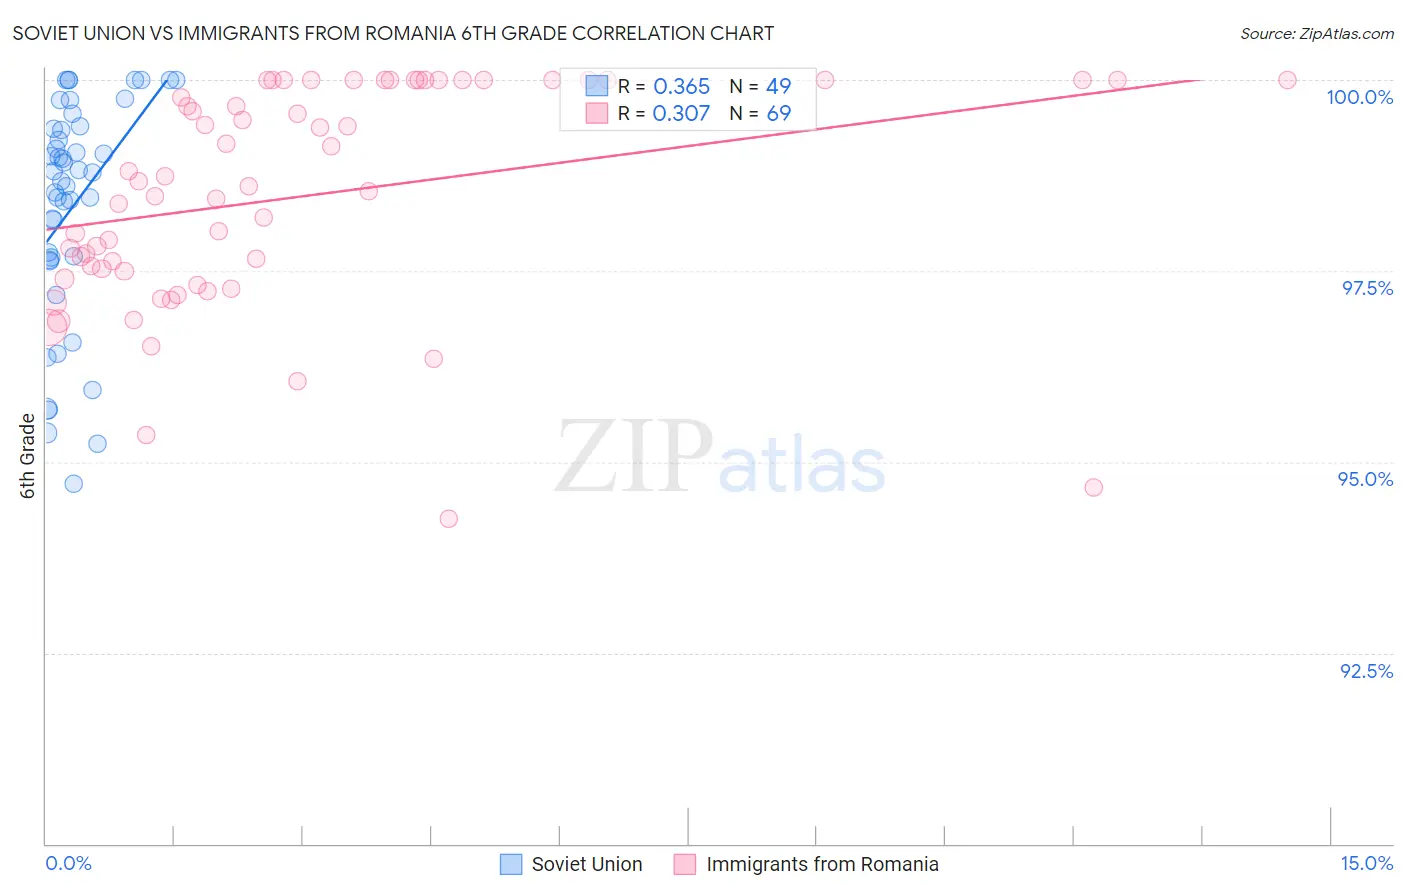
Soviet Union vs Immigrants from Romania 6th Grade Correlation Chart
The statistical analysis conducted on geographies consisting of 43,454,395 people shows a mild positive correlation between the proportion of Soviet Union and percentage of population with at least 6th grade education in the United States with a correlation coefficient (R) of 0.365 and weighted average of 97.2%. Similarly, the statistical analysis conducted on geographies consisting of 257,008,799 people shows a mild positive correlation between the proportion of Immigrants from Romania and percentage of population with at least 6th grade education in the United States with a correlation coefficient (R) of 0.307 and weighted average of 97.3%, a difference of 0.17%.
6th Grade Correlation Summary
| Measurement | Soviet Union | Immigrants from Romania |
| Minimum | 94.7% | 94.3% |
| Maximum | 100.0% | 100.0% |
| Range | 5.3% | 5.7% |
| Mean | 98.3% | 98.5% |
| Median | 98.8% | 98.6% |
| Interquartile 25% (IQ1) | 97.7% | 97.4% |
| Interquartile 75% (IQ3) | 99.4% | 100.0% |
| Interquartile Range (IQR) | 1.7% | 2.6% |
| Standard Deviation (Sample) | 1.4% | 1.4% |
| Standard Deviation (Population) | 1.4% | 1.4% |
Similar Demographics by 6th Grade
Demographics Similar to Soviet Union by 6th Grade
In terms of 6th grade, the demographic groups most similar to Soviet Union are Ute (97.1%, a difference of 0.0%), French American Indian (97.2%, a difference of 0.010%), Immigrants from Jordan (97.2%, a difference of 0.010%), Immigrants from Eastern Europe (97.2%, a difference of 0.010%), and Alsatian (97.1%, a difference of 0.010%).
| Demographics | Rating | Rank | 6th Grade |
| Immigrants | South Central Asia | 78.1 /100 | #147 | Good 97.2% |
| Immigrants | Greece | 77.8 /100 | #148 | Good 97.2% |
| Immigrants | Israel | 76.0 /100 | #149 | Good 97.2% |
| Immigrants | Bosnia and Herzegovina | 74.8 /100 | #150 | Good 97.2% |
| French American Indians | 74.0 /100 | #151 | Good 97.2% |
| Immigrants | Jordan | 73.0 /100 | #152 | Good 97.2% |
| Immigrants | Eastern Europe | 72.6 /100 | #153 | Good 97.2% |
| Soviet Union | 71.5 /100 | #154 | Good 97.2% |
| Ute | 71.1 /100 | #155 | Good 97.1% |
| Alsatians | 69.8 /100 | #156 | Good 97.1% |
| Immigrants | Russia | 67.6 /100 | #157 | Good 97.1% |
| Immigrants | Iran | 63.3 /100 | #158 | Good 97.1% |
| Kenyans | 62.9 /100 | #159 | Good 97.1% |
| Ugandans | 62.2 /100 | #160 | Good 97.1% |
| Immigrants | Belarus | 60.4 /100 | #161 | Good 97.1% |
Demographics Similar to Immigrants from Romania by 6th Grade
In terms of 6th grade, the demographic groups most similar to Immigrants from Romania are Immigrants from Serbia (97.3%, a difference of 0.0%), Cambodian (97.3%, a difference of 0.0%), Immigrants from Europe (97.3%, a difference of 0.010%), Immigrants from Croatia (97.3%, a difference of 0.020%), and Palestinian (97.3%, a difference of 0.020%).
| Demographics | Rating | Rank | 6th Grade |
| Immigrants | Norway | 94.7 /100 | #121 | Exceptional 97.4% |
| Immigrants | France | 94.5 /100 | #122 | Exceptional 97.4% |
| Hmong | 94.4 /100 | #123 | Exceptional 97.4% |
| Okinawans | 94.2 /100 | #124 | Exceptional 97.4% |
| Spanish | 93.7 /100 | #125 | Exceptional 97.3% |
| Immigrants | Bulgaria | 93.6 /100 | #126 | Exceptional 97.3% |
| Immigrants | Croatia | 93.1 /100 | #127 | Exceptional 97.3% |
| Immigrants | Romania | 92.0 /100 | #128 | Exceptional 97.3% |
| Immigrants | Serbia | 91.9 /100 | #129 | Exceptional 97.3% |
| Cambodians | 91.8 /100 | #130 | Exceptional 97.3% |
| Immigrants | Europe | 91.1 /100 | #131 | Exceptional 97.3% |
| Palestinians | 90.9 /100 | #132 | Exceptional 97.3% |
| Immigrants | Moldova | 90.0 /100 | #133 | Excellent 97.3% |
| Immigrants | Kuwait | 89.5 /100 | #134 | Excellent 97.3% |
| Immigrants | Hungary | 89.5 /100 | #135 | Excellent 97.3% |