Soviet Union vs Immigrants from China Median Family Income
COMPARE
Soviet Union
Immigrants from China
Median Family Income
Median Family Income Comparison
Soviet Union
Immigrants from China
$119,262
MEDIAN FAMILY INCOME
100.0/ 100
METRIC RATING
35th/ 347
METRIC RANK
$125,540
MEDIAN FAMILY INCOME
100.0/ 100
METRIC RATING
16th/ 347
METRIC RANK
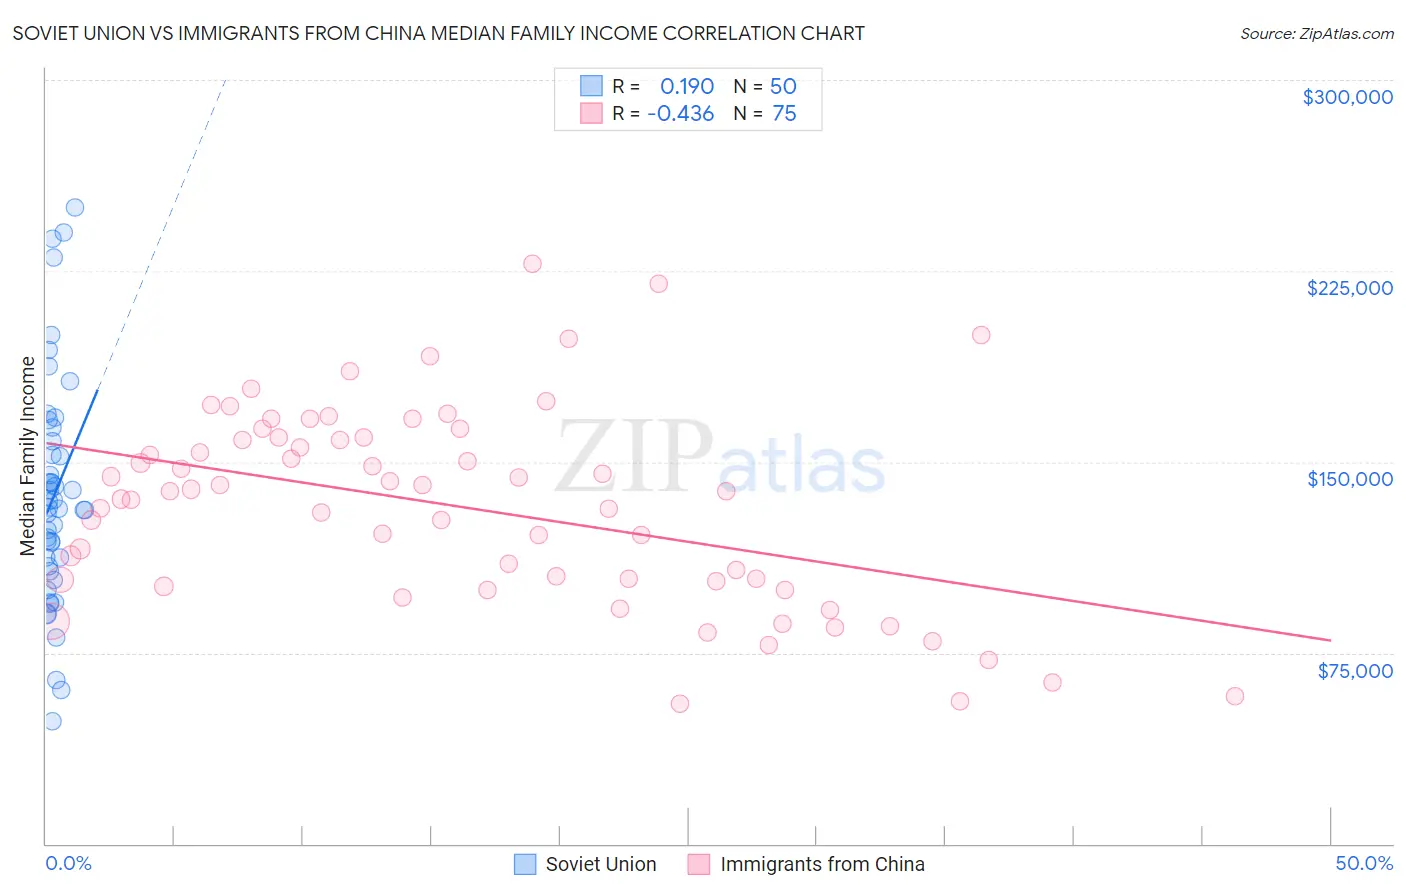
Soviet Union vs Immigrants from China Median Family Income Correlation Chart
The statistical analysis conducted on geographies consisting of 43,509,630 people shows a poor positive correlation between the proportion of Soviet Union and median family income in the United States with a correlation coefficient (R) of 0.190 and weighted average of $119,262. Similarly, the statistical analysis conducted on geographies consisting of 456,354,343 people shows a moderate negative correlation between the proportion of Immigrants from China and median family income in the United States with a correlation coefficient (R) of -0.436 and weighted average of $125,540, a difference of 5.3%.
Median Family Income Correlation Summary
| Measurement | Soviet Union | Immigrants from China |
| Minimum | $48,254 | $55,016 |
| Maximum | $250,001 | $227,676 |
| Range | $201,747 | $172,660 |
| Mean | $137,051 | $132,303 |
| Median | $132,006 | $138,661 |
| Interquartile 25% (IQ1) | $109,232 | $103,301 |
| Interquartile 75% (IQ3) | $157,989 | $159,432 |
| Interquartile Range (IQR) | $48,757 | $56,131 |
| Standard Deviation (Sample) | $44,628 | $38,553 |
| Standard Deviation (Population) | $44,180 | $38,295 |
Demographics Similar to Soviet Union and Immigrants from China by Median Family Income
In terms of median family income, the demographic groups most similar to Soviet Union are Bolivian ($119,479, a difference of 0.18%), Bhutanese ($119,800, a difference of 0.45%), Asian ($119,955, a difference of 0.58%), Immigrants from France ($120,076, a difference of 0.68%), and Immigrants from Sri Lanka ($120,263, a difference of 0.84%). Similarly, the demographic groups most similar to Immigrants from China are Eastern European ($125,546, a difference of 0.0%), Indian (Asian) ($125,312, a difference of 0.18%), Immigrants from Eastern Asia ($125,150, a difference of 0.31%), Immigrants from Belgium ($123,831, a difference of 1.4%), and Burmese ($123,369, a difference of 1.8%).
| Demographics | Rating | Rank | Median Family Income |
| Eastern Europeans | 100.0 /100 | #15 | Exceptional $125,546 |
| Immigrants | China | 100.0 /100 | #16 | Exceptional $125,540 |
| Indians (Asian) | 100.0 /100 | #17 | Exceptional $125,312 |
| Immigrants | Eastern Asia | 100.0 /100 | #18 | Exceptional $125,150 |
| Immigrants | Belgium | 100.0 /100 | #19 | Exceptional $123,831 |
| Burmese | 100.0 /100 | #20 | Exceptional $123,369 |
| Immigrants | Korea | 100.0 /100 | #21 | Exceptional $122,800 |
| Immigrants | Sweden | 100.0 /100 | #22 | Exceptional $122,765 |
| Immigrants | Japan | 100.0 /100 | #23 | Exceptional $122,764 |
| Immigrants | Northern Europe | 100.0 /100 | #24 | Exceptional $121,840 |
| Turks | 100.0 /100 | #25 | Exceptional $121,202 |
| Immigrants | Switzerland | 100.0 /100 | #26 | Exceptional $120,726 |
| Russians | 100.0 /100 | #27 | Exceptional $120,487 |
| Immigrants | Denmark | 100.0 /100 | #28 | Exceptional $120,445 |
| Latvians | 100.0 /100 | #29 | Exceptional $120,301 |
| Immigrants | Sri Lanka | 100.0 /100 | #30 | Exceptional $120,263 |
| Immigrants | France | 100.0 /100 | #31 | Exceptional $120,076 |
| Asians | 100.0 /100 | #32 | Exceptional $119,955 |
| Bhutanese | 100.0 /100 | #33 | Exceptional $119,800 |
| Bolivians | 100.0 /100 | #34 | Exceptional $119,479 |
| Soviet Union | 100.0 /100 | #35 | Exceptional $119,262 |