South American Indian vs Tlingit-Haida 3rd Grade
COMPARE
South American Indian
Tlingit-Haida
3rd Grade
3rd Grade Comparison
South American Indians
Tlingit-Haida
97.5%
3RD GRADE
5.7/ 100
METRIC RATING
217th/ 347
METRIC RANK
98.5%
3RD GRADE
100.0/ 100
METRIC RATING
13th/ 347
METRIC RANK
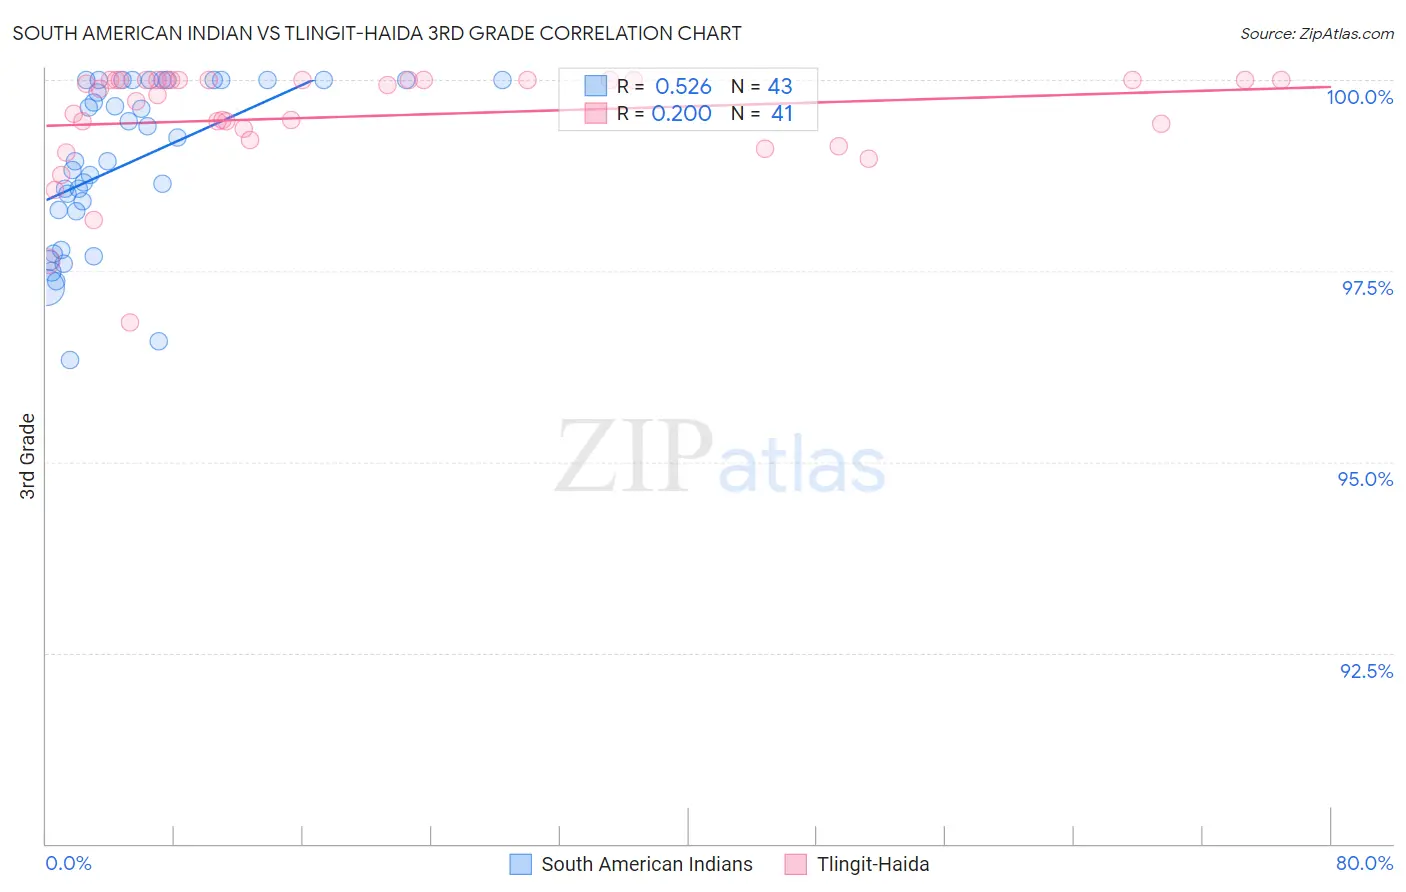
South American Indian vs Tlingit-Haida 3rd Grade Correlation Chart
The statistical analysis conducted on geographies consisting of 164,573,401 people shows a substantial positive correlation between the proportion of South American Indians and percentage of population with at least 3rd grade education in the United States with a correlation coefficient (R) of 0.526 and weighted average of 97.5%. Similarly, the statistical analysis conducted on geographies consisting of 60,865,648 people shows a poor positive correlation between the proportion of Tlingit-Haida and percentage of population with at least 3rd grade education in the United States with a correlation coefficient (R) of 0.200 and weighted average of 98.5%, a difference of 1.1%.
3rd Grade Correlation Summary
| Measurement | South American Indian | Tlingit-Haida |
| Minimum | 96.3% | 96.8% |
| Maximum | 100.0% | 100.0% |
| Range | 3.7% | 3.2% |
| Mean | 98.9% | 99.5% |
| Median | 98.9% | 99.9% |
| Interquartile 25% (IQ1) | 98.3% | 99.3% |
| Interquartile 75% (IQ3) | 100.0% | 100.0% |
| Interquartile Range (IQR) | 1.7% | 0.71% |
| Standard Deviation (Sample) | 1.1% | 0.71% |
| Standard Deviation (Population) | 1.1% | 0.70% |
Similar Demographics by 3rd Grade
Demographics Similar to South American Indians by 3rd Grade
In terms of 3rd grade, the demographic groups most similar to South American Indians are Immigrants from Nepal (97.5%, a difference of 0.010%), Immigrants from Panama (97.5%, a difference of 0.010%), Immigrants from Morocco (97.5%, a difference of 0.010%), Uruguayan (97.5%, a difference of 0.010%), and Iraqi (97.5%, a difference of 0.020%).
| Demographics | Rating | Rank | 3rd Grade |
| Immigrants | Oceania | 9.5 /100 | #210 | Tragic 97.6% |
| Laotians | 9.4 /100 | #211 | Tragic 97.6% |
| Immigrants | Bahamas | 8.5 /100 | #212 | Tragic 97.6% |
| Moroccans | 8.5 /100 | #213 | Tragic 97.6% |
| Yuman | 8.4 /100 | #214 | Tragic 97.6% |
| Iraqis | 6.9 /100 | #215 | Tragic 97.5% |
| Samoans | 6.9 /100 | #216 | Tragic 97.5% |
| South American Indians | 5.7 /100 | #217 | Tragic 97.5% |
| Immigrants | Nepal | 5.3 /100 | #218 | Tragic 97.5% |
| Immigrants | Panama | 5.2 /100 | #219 | Tragic 97.5% |
| Immigrants | Morocco | 5.0 /100 | #220 | Tragic 97.5% |
| Uruguayans | 5.0 /100 | #221 | Tragic 97.5% |
| Sierra Leoneans | 4.6 /100 | #222 | Tragic 97.5% |
| Immigrants | Syria | 4.4 /100 | #223 | Tragic 97.5% |
| Bahamians | 4.4 /100 | #224 | Tragic 97.5% |
Demographics Similar to Tlingit-Haida by 3rd Grade
In terms of 3rd grade, the demographic groups most similar to Tlingit-Haida are English (98.6%, a difference of 0.0%), Carpatho Rusyn (98.5%, a difference of 0.0%), Swedish (98.5%, a difference of 0.010%), Alaska Native (98.6%, a difference of 0.020%), and Slovene (98.6%, a difference of 0.020%).
| Demographics | Rating | Rank | 3rd Grade |
| Alaskan Athabascans | 100.0 /100 | #6 | Exceptional 98.7% |
| Norwegians | 100.0 /100 | #7 | Exceptional 98.6% |
| Slovaks | 100.0 /100 | #8 | Exceptional 98.6% |
| Germans | 100.0 /100 | #9 | Exceptional 98.6% |
| Alaska Natives | 100.0 /100 | #10 | Exceptional 98.6% |
| Slovenes | 100.0 /100 | #11 | Exceptional 98.6% |
| English | 100.0 /100 | #12 | Exceptional 98.6% |
| Tlingit-Haida | 100.0 /100 | #13 | Exceptional 98.5% |
| Carpatho Rusyns | 100.0 /100 | #14 | Exceptional 98.5% |
| Swedes | 100.0 /100 | #15 | Exceptional 98.5% |
| Scottish | 100.0 /100 | #16 | Exceptional 98.5% |
| Dutch | 100.0 /100 | #17 | Exceptional 98.5% |
| Irish | 100.0 /100 | #18 | Exceptional 98.5% |
| Poles | 100.0 /100 | #19 | Exceptional 98.5% |
| Pennsylvania Germans | 100.0 /100 | #20 | Exceptional 98.5% |