Hopi vs Subsaharan African Median Family Income
COMPARE
Hopi
Subsaharan African
Median Family Income
Median Family Income Comparison
Hopi
Sub-Saharan Africans
$77,188
MEDIAN FAMILY INCOME
0.0/ 100
METRIC RATING
340th/ 347
METRIC RANK
$93,748
MEDIAN FAMILY INCOME
1.0/ 100
METRIC RATING
244th/ 347
METRIC RANK
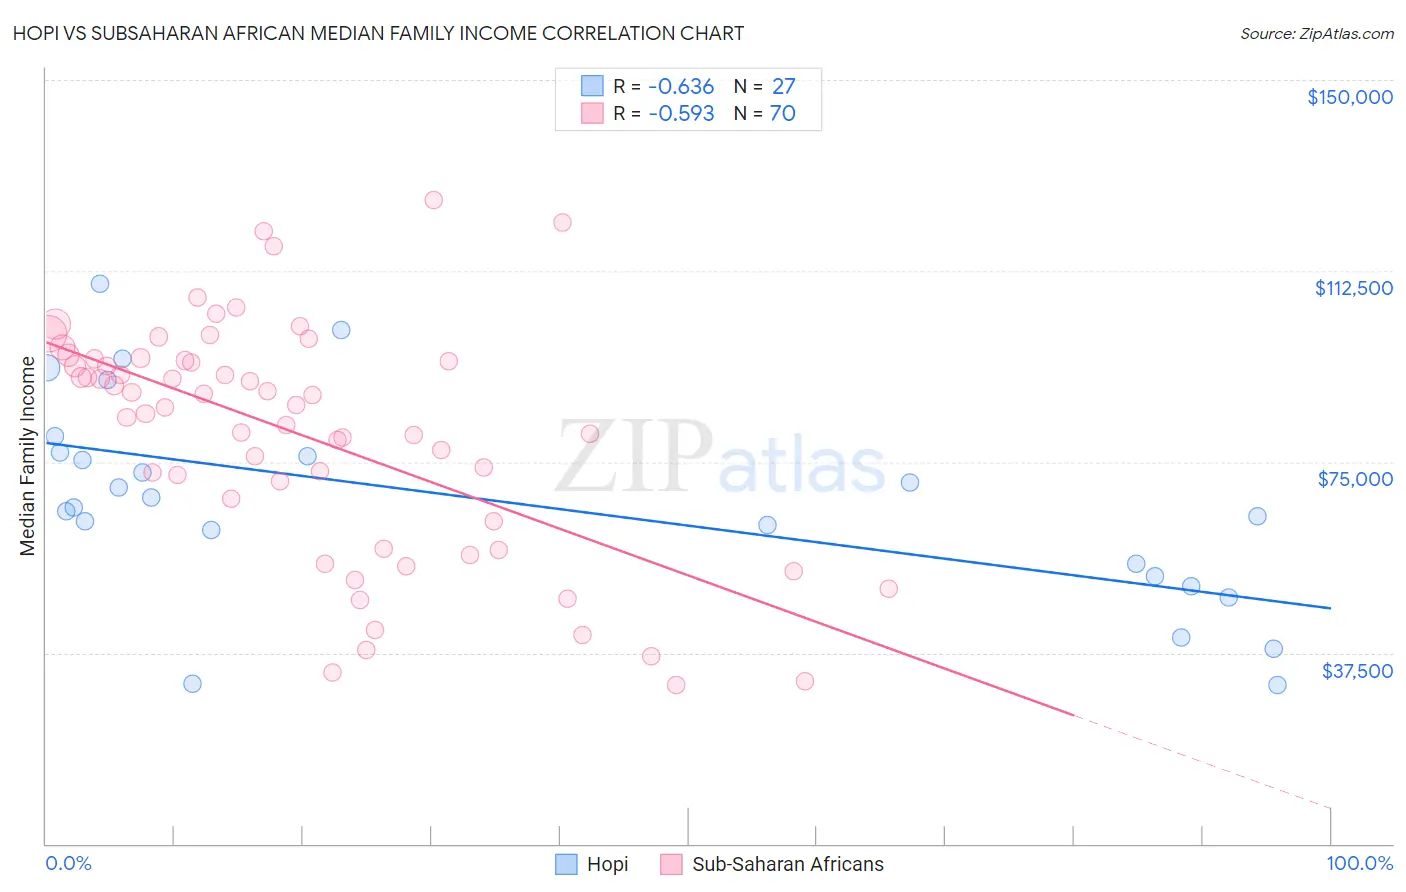
Hopi vs Subsaharan African Median Family Income Correlation Chart
The statistical analysis conducted on geographies consisting of 74,729,125 people shows a significant negative correlation between the proportion of Hopi and median family income in the United States with a correlation coefficient (R) of -0.636 and weighted average of $77,188. Similarly, the statistical analysis conducted on geographies consisting of 507,233,451 people shows a substantial negative correlation between the proportion of Sub-Saharan Africans and median family income in the United States with a correlation coefficient (R) of -0.593 and weighted average of $93,748, a difference of 21.4%.
Median Family Income Correlation Summary
| Measurement | Hopi | Subsaharan African |
| Minimum | $31,250 | $31,084 |
| Maximum | $109,922 | $126,507 |
| Range | $78,672 | $95,423 |
| Mean | $67,112 | $80,060 |
| Median | $66,093 | $85,890 |
| Interquartile 25% (IQ1) | $52,500 | $63,281 |
| Interquartile 75% (IQ3) | $76,955 | $94,886 |
| Interquartile Range (IQR) | $24,455 | $31,605 |
| Standard Deviation (Sample) | $20,243 | $22,942 |
| Standard Deviation (Population) | $19,865 | $22,778 |
Similar Demographics by Median Family Income
Demographics Similar to Hopi by Median Family Income
In terms of median family income, the demographic groups most similar to Hopi are Pima ($77,431, a difference of 0.32%), Immigrants from Yemen ($77,457, a difference of 0.35%), Pueblo ($76,880, a difference of 0.40%), Crow ($76,605, a difference of 0.76%), and Yuman ($78,055, a difference of 1.1%).
| Demographics | Rating | Rank | Median Family Income |
| Kiowa | 0.0 /100 | #333 | Tragic $80,885 |
| Menominee | 0.0 /100 | #334 | Tragic $79,563 |
| Yup'ik | 0.0 /100 | #335 | Tragic $79,290 |
| Immigrants | Cuba | 0.0 /100 | #336 | Tragic $78,249 |
| Yuman | 0.0 /100 | #337 | Tragic $78,055 |
| Immigrants | Yemen | 0.0 /100 | #338 | Tragic $77,457 |
| Pima | 0.0 /100 | #339 | Tragic $77,431 |
| Hopi | 0.0 /100 | #340 | Tragic $77,188 |
| Pueblo | 0.0 /100 | #341 | Tragic $76,880 |
| Crow | 0.0 /100 | #342 | Tragic $76,605 |
| Houma | 0.0 /100 | #343 | Tragic $76,188 |
| Tohono O'odham | 0.0 /100 | #344 | Tragic $72,193 |
| Navajo | 0.0 /100 | #345 | Tragic $70,989 |
| Puerto Ricans | 0.0 /100 | #346 | Tragic $70,423 |
| Lumbee | 0.0 /100 | #347 | Tragic $68,679 |
Demographics Similar to Sub-Saharan Africans by Median Family Income
In terms of median family income, the demographic groups most similar to Sub-Saharan Africans are German Russian ($93,858, a difference of 0.12%), Immigrants from Middle Africa ($93,593, a difference of 0.17%), Barbadian ($93,919, a difference of 0.18%), Immigrants from Trinidad and Tobago ($93,988, a difference of 0.26%), and Somali ($94,085, a difference of 0.36%).
| Demographics | Rating | Rank | Median Family Income |
| Alaskan Athabascans | 1.5 /100 | #237 | Tragic $94,429 |
| Nepalese | 1.3 /100 | #238 | Tragic $94,153 |
| Salvadorans | 1.2 /100 | #239 | Tragic $94,109 |
| Somalis | 1.2 /100 | #240 | Tragic $94,085 |
| Immigrants | Trinidad and Tobago | 1.2 /100 | #241 | Tragic $93,988 |
| Barbadians | 1.1 /100 | #242 | Tragic $93,919 |
| German Russians | 1.1 /100 | #243 | Tragic $93,858 |
| Sub-Saharan Africans | 1.0 /100 | #244 | Tragic $93,748 |
| Immigrants | Middle Africa | 1.0 /100 | #245 | Tragic $93,593 |
| Guyanese | 0.9 /100 | #246 | Tragic $93,373 |
| Immigrants | Senegal | 0.7 /100 | #247 | Tragic $92,912 |
| French American Indians | 0.7 /100 | #248 | Tragic $92,872 |
| Immigrants | Ecuador | 0.7 /100 | #249 | Tragic $92,837 |
| West Indians | 0.6 /100 | #250 | Tragic $92,765 |
| Immigrants | Somalia | 0.6 /100 | #251 | Tragic $92,609 |