Somali vs Luxembourger Median Household Income
COMPARE
Somali
Luxembourger
Median Household Income
Median Household Income Comparison
Somalis
Luxembourgers
$75,782
MEDIAN HOUSEHOLD INCOME
0.3/ 100
METRIC RATING
272nd/ 347
METRIC RANK
$86,418
MEDIAN HOUSEHOLD INCOME
70.0/ 100
METRIC RATING
160th/ 347
METRIC RANK
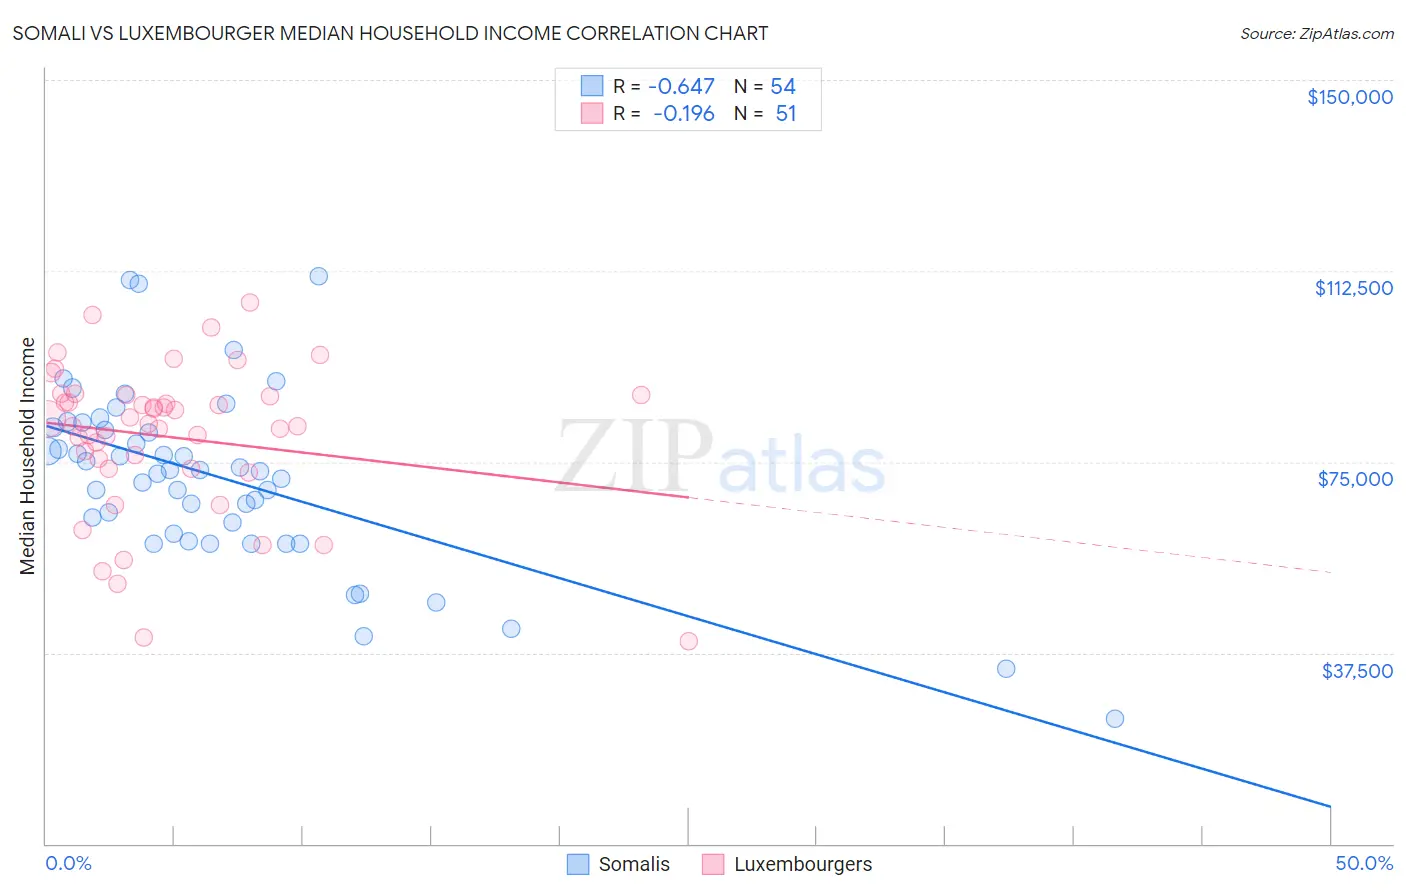
Somali vs Luxembourger Median Household Income Correlation Chart
The statistical analysis conducted on geographies consisting of 99,284,368 people shows a significant negative correlation between the proportion of Somalis and median household income in the United States with a correlation coefficient (R) of -0.647 and weighted average of $75,782. Similarly, the statistical analysis conducted on geographies consisting of 144,630,176 people shows a poor negative correlation between the proportion of Luxembourgers and median household income in the United States with a correlation coefficient (R) of -0.196 and weighted average of $86,418, a difference of 14.0%.
Median Household Income Correlation Summary
| Measurement | Somali | Luxembourger |
| Minimum | $24,660 | $39,750 |
| Maximum | $111,550 | $106,423 |
| Range | $86,890 | $66,673 |
| Mean | $71,854 | $79,856 |
| Median | $73,292 | $82,566 |
| Interquartile 25% (IQ1) | $60,808 | $73,750 |
| Interquartile 75% (IQ3) | $81,847 | $88,077 |
| Interquartile Range (IQR) | $21,039 | $14,327 |
| Standard Deviation (Sample) | $17,515 | $14,707 |
| Standard Deviation (Population) | $17,352 | $14,562 |
Similar Demographics by Median Household Income
Demographics Similar to Somalis by Median Household Income
In terms of median household income, the demographic groups most similar to Somalis are Pennsylvania German ($75,814, a difference of 0.040%), Hmong ($75,839, a difference of 0.080%), Immigrants from Jamaica ($75,851, a difference of 0.090%), Cape Verdean ($75,848, a difference of 0.090%), and German Russian ($75,856, a difference of 0.10%).
| Demographics | Rating | Rank | Median Household Income |
| Immigrants | Belize | 0.3 /100 | #265 | Tragic $75,938 |
| Americans | 0.3 /100 | #266 | Tragic $75,932 |
| German Russians | 0.3 /100 | #267 | Tragic $75,856 |
| Immigrants | Jamaica | 0.3 /100 | #268 | Tragic $75,851 |
| Cape Verdeans | 0.3 /100 | #269 | Tragic $75,848 |
| Hmong | 0.3 /100 | #270 | Tragic $75,839 |
| Pennsylvania Germans | 0.3 /100 | #271 | Tragic $75,814 |
| Somalis | 0.3 /100 | #272 | Tragic $75,782 |
| Liberians | 0.2 /100 | #273 | Tragic $75,667 |
| British West Indians | 0.2 /100 | #274 | Tragic $75,647 |
| Immigrants | Micronesia | 0.2 /100 | #275 | Tragic $75,574 |
| Immigrants | Latin America | 0.2 /100 | #276 | Tragic $75,420 |
| Spanish Americans | 0.2 /100 | #277 | Tragic $75,386 |
| Osage | 0.2 /100 | #278 | Tragic $75,240 |
| Immigrants | Guatemala | 0.2 /100 | #279 | Tragic $75,123 |
Demographics Similar to Luxembourgers by Median Household Income
In terms of median household income, the demographic groups most similar to Luxembourgers are Immigrants from Uzbekistan ($86,425, a difference of 0.010%), Slavic ($86,398, a difference of 0.020%), Moroccan ($86,468, a difference of 0.060%), Samoan ($86,498, a difference of 0.090%), and Immigrants from Albania ($86,534, a difference of 0.13%).
| Demographics | Rating | Rank | Median Household Income |
| South Americans | 75.1 /100 | #153 | Good $86,824 |
| Immigrants | Germany | 74.4 /100 | #154 | Good $86,764 |
| Carpatho Rusyns | 72.8 /100 | #155 | Good $86,635 |
| Immigrants | Albania | 71.5 /100 | #156 | Good $86,534 |
| Samoans | 71.0 /100 | #157 | Good $86,498 |
| Moroccans | 70.6 /100 | #158 | Good $86,468 |
| Immigrants | Uzbekistan | 70.1 /100 | #159 | Good $86,425 |
| Luxembourgers | 70.0 /100 | #160 | Good $86,418 |
| Slavs | 69.7 /100 | #161 | Good $86,398 |
| Guamanians/Chamorros | 67.7 /100 | #162 | Good $86,255 |
| Czechs | 66.4 /100 | #163 | Good $86,164 |
| Irish | 66.2 /100 | #164 | Good $86,145 |
| Norwegians | 65.3 /100 | #165 | Good $86,084 |
| Scandinavians | 65.1 /100 | #166 | Good $86,073 |
| Immigrants | Immigrants | 61.3 /100 | #167 | Good $85,818 |