Somali vs Immigrants from Singapore Median Household Income
COMPARE
Somali
Immigrants from Singapore
Median Household Income
Median Household Income Comparison
Somalis
Immigrants from Singapore
$75,782
MEDIAN HOUSEHOLD INCOME
0.3/ 100
METRIC RATING
272nd/ 347
METRIC RANK
$110,428
MEDIAN HOUSEHOLD INCOME
100.0/ 100
METRIC RATING
6th/ 347
METRIC RANK
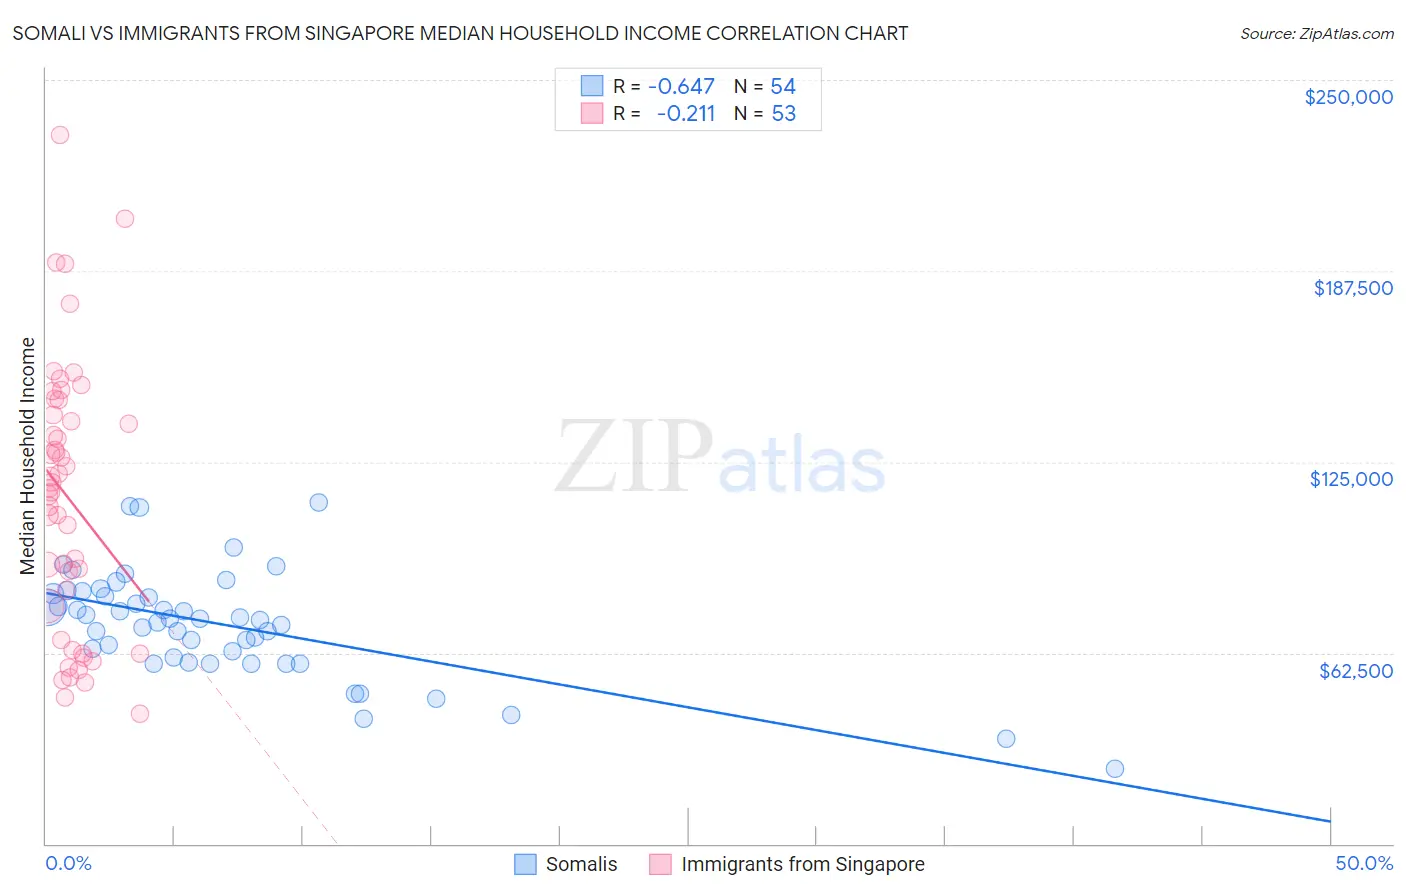
Somali vs Immigrants from Singapore Median Household Income Correlation Chart
The statistical analysis conducted on geographies consisting of 99,284,368 people shows a significant negative correlation between the proportion of Somalis and median household income in the United States with a correlation coefficient (R) of -0.647 and weighted average of $75,782. Similarly, the statistical analysis conducted on geographies consisting of 137,415,639 people shows a weak negative correlation between the proportion of Immigrants from Singapore and median household income in the United States with a correlation coefficient (R) of -0.211 and weighted average of $110,428, a difference of 45.7%.
Median Household Income Correlation Summary
| Measurement | Somali | Immigrants from Singapore |
| Minimum | $24,660 | $42,500 |
| Maximum | $111,550 | $232,046 |
| Range | $86,890 | $189,546 |
| Mean | $71,854 | $113,253 |
| Median | $73,292 | $116,276 |
| Interquartile 25% (IQ1) | $60,808 | $72,208 |
| Interquartile 75% (IQ3) | $81,847 | $142,877 |
| Interquartile Range (IQR) | $21,039 | $70,669 |
| Standard Deviation (Sample) | $17,515 | $43,740 |
| Standard Deviation (Population) | $17,352 | $43,325 |
Similar Demographics by Median Household Income
Demographics Similar to Somalis by Median Household Income
In terms of median household income, the demographic groups most similar to Somalis are Pennsylvania German ($75,814, a difference of 0.040%), Hmong ($75,839, a difference of 0.080%), Immigrants from Jamaica ($75,851, a difference of 0.090%), Cape Verdean ($75,848, a difference of 0.090%), and German Russian ($75,856, a difference of 0.10%).
| Demographics | Rating | Rank | Median Household Income |
| Immigrants | Belize | 0.3 /100 | #265 | Tragic $75,938 |
| Americans | 0.3 /100 | #266 | Tragic $75,932 |
| German Russians | 0.3 /100 | #267 | Tragic $75,856 |
| Immigrants | Jamaica | 0.3 /100 | #268 | Tragic $75,851 |
| Cape Verdeans | 0.3 /100 | #269 | Tragic $75,848 |
| Hmong | 0.3 /100 | #270 | Tragic $75,839 |
| Pennsylvania Germans | 0.3 /100 | #271 | Tragic $75,814 |
| Somalis | 0.3 /100 | #272 | Tragic $75,782 |
| Liberians | 0.2 /100 | #273 | Tragic $75,667 |
| British West Indians | 0.2 /100 | #274 | Tragic $75,647 |
| Immigrants | Micronesia | 0.2 /100 | #275 | Tragic $75,574 |
| Immigrants | Latin America | 0.2 /100 | #276 | Tragic $75,420 |
| Spanish Americans | 0.2 /100 | #277 | Tragic $75,386 |
| Osage | 0.2 /100 | #278 | Tragic $75,240 |
| Immigrants | Guatemala | 0.2 /100 | #279 | Tragic $75,123 |
Demographics Similar to Immigrants from Singapore by Median Household Income
In terms of median household income, the demographic groups most similar to Immigrants from Singapore are Thai ($110,648, a difference of 0.20%), Iranian ($109,835, a difference of 0.54%), Immigrants from Hong Kong ($111,519, a difference of 0.99%), Immigrants from Iran ($108,055, a difference of 2.2%), and Immigrants from India ($113,009, a difference of 2.3%).
| Demographics | Rating | Rank | Median Household Income |
| Immigrants | Taiwan | 100.0 /100 | #1 | Exceptional $116,460 |
| Filipinos | 100.0 /100 | #2 | Exceptional $115,509 |
| Immigrants | India | 100.0 /100 | #3 | Exceptional $113,009 |
| Immigrants | Hong Kong | 100.0 /100 | #4 | Exceptional $111,519 |
| Thais | 100.0 /100 | #5 | Exceptional $110,648 |
| Immigrants | Singapore | 100.0 /100 | #6 | Exceptional $110,428 |
| Iranians | 100.0 /100 | #7 | Exceptional $109,835 |
| Immigrants | Iran | 100.0 /100 | #8 | Exceptional $108,055 |
| Okinawans | 100.0 /100 | #9 | Exceptional $106,624 |
| Immigrants | South Central Asia | 100.0 /100 | #10 | Exceptional $106,057 |
| Immigrants | China | 100.0 /100 | #11 | Exceptional $105,335 |
| Indians (Asian) | 100.0 /100 | #12 | Exceptional $105,262 |
| Immigrants | Eastern Asia | 100.0 /100 | #13 | Exceptional $104,796 |
| Immigrants | Ireland | 100.0 /100 | #14 | Exceptional $104,692 |
| Immigrants | Israel | 100.0 /100 | #15 | Exceptional $104,090 |