Somali vs Bermudan Householder Income Under 25 years
COMPARE
Somali
Bermudan
Householder Income Under 25 years
Householder Income Under 25 years Comparison
Somalis
Bermudans
$48,657
HOUSEHOLDER INCOME UNDER 25 YEARS
0.0/ 100
METRIC RATING
294th/ 347
METRIC RANK
$47,359
HOUSEHOLDER INCOME UNDER 25 YEARS
0.0/ 100
METRIC RATING
312th/ 347
METRIC RANK
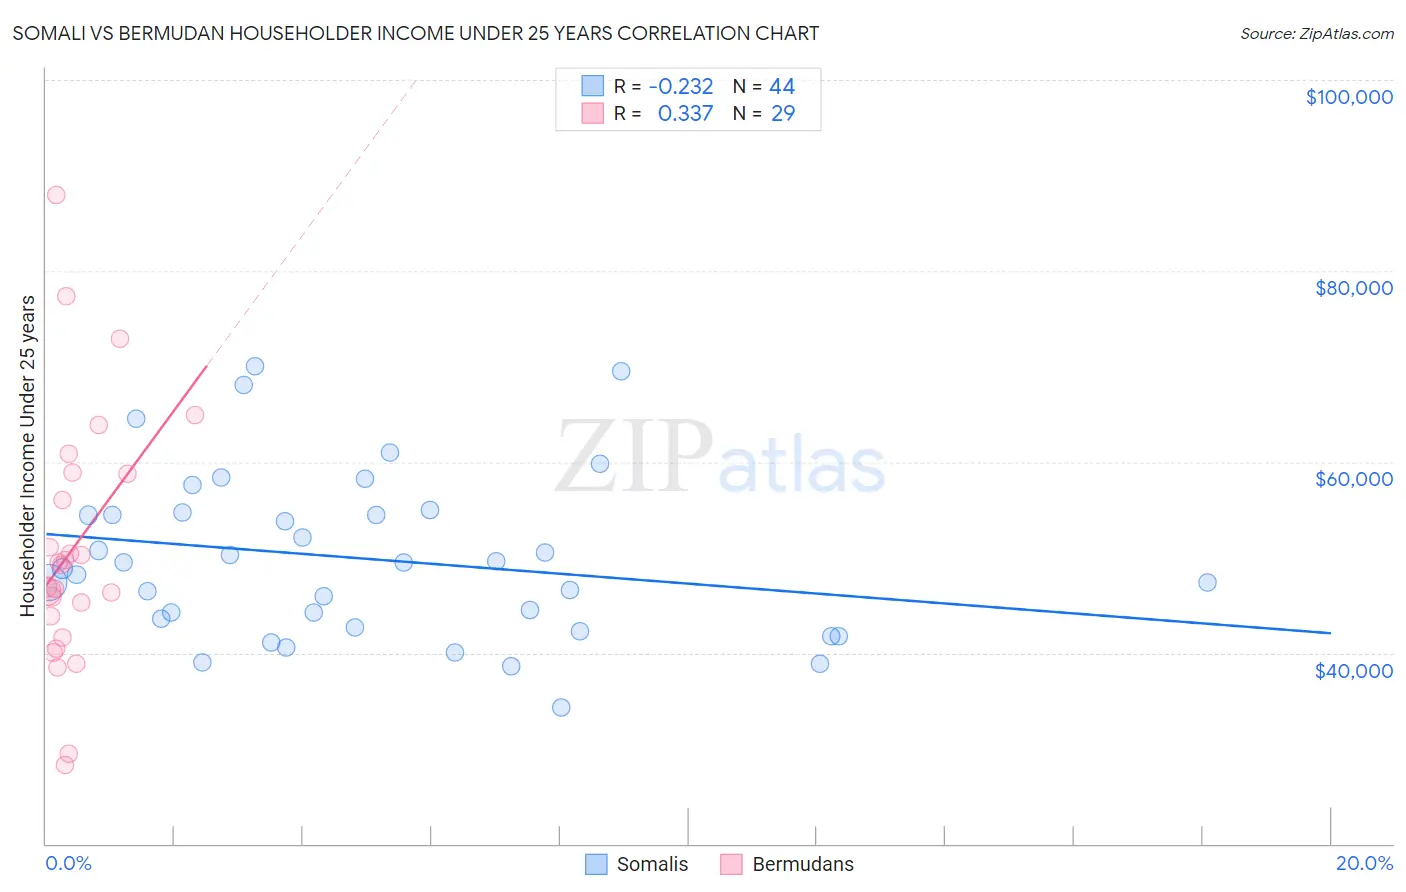
Somali vs Bermudan Householder Income Under 25 years Correlation Chart
The statistical analysis conducted on geographies consisting of 95,208,106 people shows a weak negative correlation between the proportion of Somalis and household income with householder under the age of 25 in the United States with a correlation coefficient (R) of -0.232 and weighted average of $48,657. Similarly, the statistical analysis conducted on geographies consisting of 52,946,816 people shows a mild positive correlation between the proportion of Bermudans and household income with householder under the age of 25 in the United States with a correlation coefficient (R) of 0.337 and weighted average of $47,359, a difference of 2.7%.
Householder Income Under 25 years Correlation Summary
| Measurement | Somali | Bermudan |
| Minimum | $34,250 | $28,306 |
| Maximum | $69,994 | $87,995 |
| Range | $35,744 | $59,689 |
| Mean | $49,862 | $51,037 |
| Median | $49,111 | $49,161 |
| Interquartile 25% (IQ1) | $43,151 | $42,763 |
| Interquartile 75% (IQ3) | $54,604 | $58,788 |
| Interquartile Range (IQR) | $11,452 | $16,024 |
| Standard Deviation (Sample) | $8,614 | $13,290 |
| Standard Deviation (Population) | $8,516 | $13,059 |
Demographics Similar to Somalis and Bermudans by Householder Income Under 25 years
In terms of householder income under 25 years, the demographic groups most similar to Somalis are Central American Indian ($48,643, a difference of 0.030%), Subsaharan African ($48,691, a difference of 0.070%), Blackfeet ($48,603, a difference of 0.11%), Cree ($48,514, a difference of 0.29%), and Yaqui ($48,300, a difference of 0.74%). Similarly, the demographic groups most similar to Bermudans are Ottawa ($47,366, a difference of 0.010%), Iroquois ($47,380, a difference of 0.040%), U.S. Virgin Islander ($47,448, a difference of 0.19%), Comanche ($47,518, a difference of 0.34%), and Delaware ($47,159, a difference of 0.43%).
| Demographics | Rating | Rank | Householder Income Under 25 years |
| Sub-Saharan Africans | 0.0 /100 | #293 | Tragic $48,691 |
| Somalis | 0.0 /100 | #294 | Tragic $48,657 |
| Central American Indians | 0.0 /100 | #295 | Tragic $48,643 |
| Blackfeet | 0.0 /100 | #296 | Tragic $48,603 |
| Cree | 0.0 /100 | #297 | Tragic $48,514 |
| Yaqui | 0.0 /100 | #298 | Tragic $48,300 |
| Immigrants | Honduras | 0.0 /100 | #299 | Tragic $48,267 |
| Immigrants | Somalia | 0.0 /100 | #300 | Tragic $48,135 |
| Immigrants | Kuwait | 0.0 /100 | #301 | Tragic $48,126 |
| Immigrants | Liberia | 0.0 /100 | #302 | Tragic $47,981 |
| Immigrants | Middle Africa | 0.0 /100 | #303 | Tragic $47,916 |
| Menominee | 0.0 /100 | #304 | Tragic $47,907 |
| Cherokee | 0.0 /100 | #305 | Tragic $47,848 |
| Natives/Alaskans | 0.0 /100 | #306 | Tragic $47,704 |
| Bangladeshis | 0.0 /100 | #307 | Tragic $47,589 |
| Comanche | 0.0 /100 | #308 | Tragic $47,518 |
| U.S. Virgin Islanders | 0.0 /100 | #309 | Tragic $47,448 |
| Iroquois | 0.0 /100 | #310 | Tragic $47,380 |
| Ottawa | 0.0 /100 | #311 | Tragic $47,366 |
| Bermudans | 0.0 /100 | #312 | Tragic $47,359 |
| Delaware | 0.0 /100 | #313 | Tragic $47,159 |