Immigrants from Ecuador vs Bermudan Householder Income Under 25 years
COMPARE
Immigrants from Ecuador
Bermudan
Householder Income Under 25 years
Householder Income Under 25 years Comparison
Immigrants from Ecuador
Bermudans
$53,722
HOUSEHOLDER INCOME UNDER 25 YEARS
97.7/ 100
METRIC RATING
109th/ 347
METRIC RANK
$47,359
HOUSEHOLDER INCOME UNDER 25 YEARS
0.0/ 100
METRIC RATING
312th/ 347
METRIC RANK
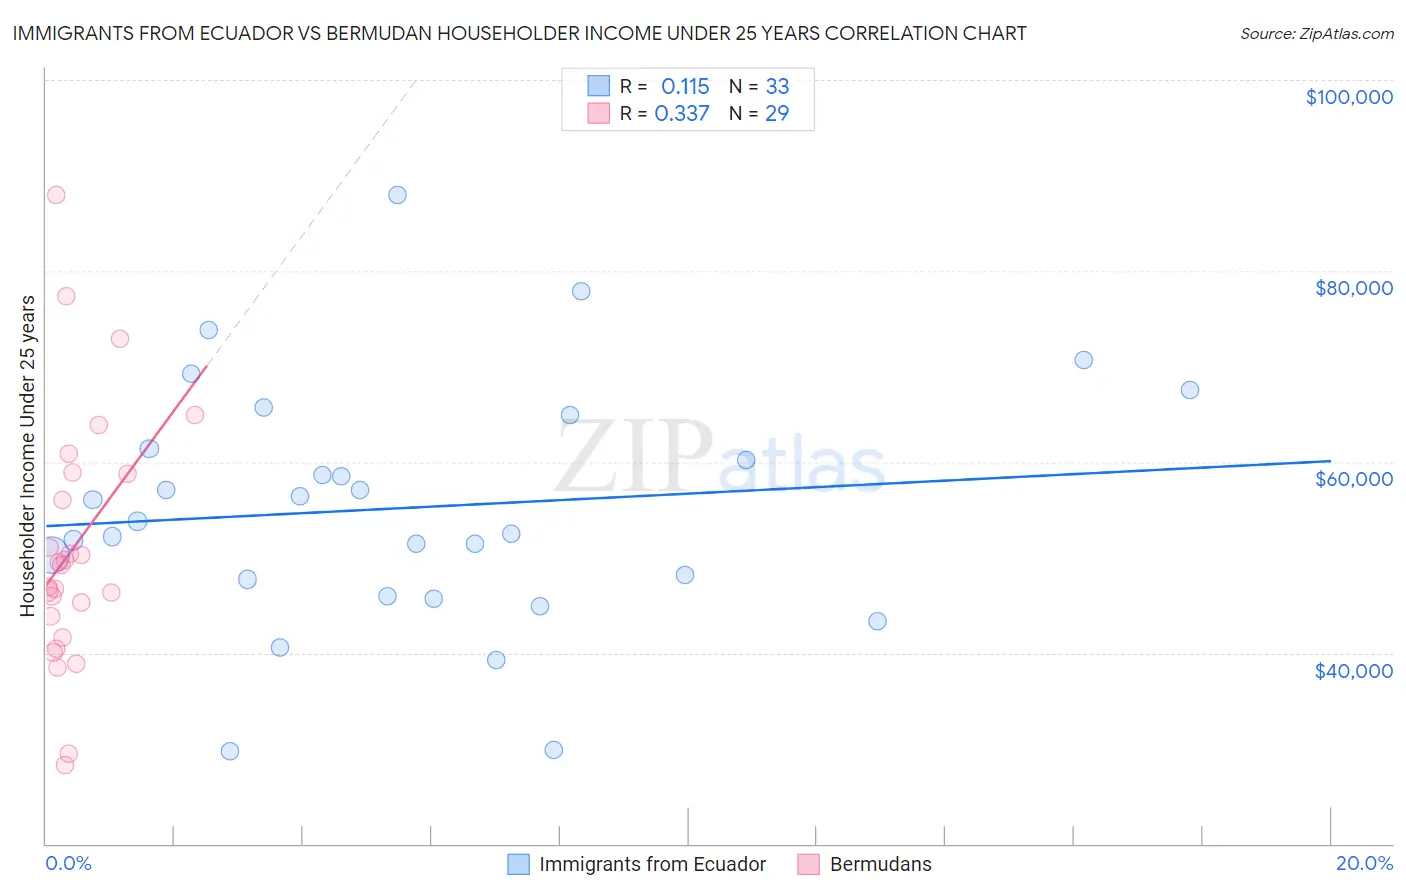
Immigrants from Ecuador vs Bermudan Householder Income Under 25 years Correlation Chart
The statistical analysis conducted on geographies consisting of 234,245,730 people shows a poor positive correlation between the proportion of Immigrants from Ecuador and household income with householder under the age of 25 in the United States with a correlation coefficient (R) of 0.115 and weighted average of $53,722. Similarly, the statistical analysis conducted on geographies consisting of 52,946,816 people shows a mild positive correlation between the proportion of Bermudans and household income with householder under the age of 25 in the United States with a correlation coefficient (R) of 0.337 and weighted average of $47,359, a difference of 13.4%.
Householder Income Under 25 years Correlation Summary
| Measurement | Immigrants from Ecuador | Bermudan |
| Minimum | $29,733 | $28,306 |
| Maximum | $87,926 | $87,995 |
| Range | $58,193 | $59,689 |
| Mean | $55,187 | $51,037 |
| Median | $53,782 | $49,161 |
| Interquartile 25% (IQ1) | $46,779 | $42,763 |
| Interquartile 75% (IQ3) | $63,173 | $58,788 |
| Interquartile Range (IQR) | $16,394 | $16,024 |
| Standard Deviation (Sample) | $12,746 | $13,290 |
| Standard Deviation (Population) | $12,552 | $13,059 |
Similar Demographics by Householder Income Under 25 years
Demographics Similar to Immigrants from Ecuador by Householder Income Under 25 years
In terms of householder income under 25 years, the demographic groups most similar to Immigrants from Ecuador are Greek ($53,715, a difference of 0.010%), Immigrants from Colombia ($53,714, a difference of 0.010%), Maltese ($53,735, a difference of 0.020%), Australian ($53,739, a difference of 0.030%), and Immigrants from Oceania ($53,680, a difference of 0.080%).
| Demographics | Rating | Rank | Householder Income Under 25 years |
| Ecuadorians | 98.5 /100 | #102 | Exceptional $53,911 |
| Ukrainians | 98.3 /100 | #103 | Exceptional $53,843 |
| Ethiopians | 98.2 /100 | #104 | Exceptional $53,818 |
| Immigrants | France | 98.1 /100 | #105 | Exceptional $53,805 |
| Albanians | 98.1 /100 | #106 | Exceptional $53,794 |
| Australians | 97.8 /100 | #107 | Exceptional $53,739 |
| Maltese | 97.8 /100 | #108 | Exceptional $53,735 |
| Immigrants | Ecuador | 97.7 /100 | #109 | Exceptional $53,722 |
| Greeks | 97.7 /100 | #110 | Exceptional $53,715 |
| Immigrants | Colombia | 97.7 /100 | #111 | Exceptional $53,714 |
| Immigrants | Oceania | 97.5 /100 | #112 | Exceptional $53,680 |
| Romanians | 97.2 /100 | #113 | Exceptional $53,632 |
| Immigrants | Sweden | 97.1 /100 | #114 | Exceptional $53,621 |
| Immigrants | Albania | 96.9 /100 | #115 | Exceptional $53,597 |
| Immigrants | Spain | 96.6 /100 | #116 | Exceptional $53,560 |
Demographics Similar to Bermudans by Householder Income Under 25 years
In terms of householder income under 25 years, the demographic groups most similar to Bermudans are Ottawa ($47,366, a difference of 0.010%), Iroquois ($47,380, a difference of 0.040%), U.S. Virgin Islander ($47,448, a difference of 0.19%), Comanche ($47,518, a difference of 0.34%), and Delaware ($47,159, a difference of 0.43%).
| Demographics | Rating | Rank | Householder Income Under 25 years |
| Cherokee | 0.0 /100 | #305 | Tragic $47,848 |
| Natives/Alaskans | 0.0 /100 | #306 | Tragic $47,704 |
| Bangladeshis | 0.0 /100 | #307 | Tragic $47,589 |
| Comanche | 0.0 /100 | #308 | Tragic $47,518 |
| U.S. Virgin Islanders | 0.0 /100 | #309 | Tragic $47,448 |
| Iroquois | 0.0 /100 | #310 | Tragic $47,380 |
| Ottawa | 0.0 /100 | #311 | Tragic $47,366 |
| Bermudans | 0.0 /100 | #312 | Tragic $47,359 |
| Delaware | 0.0 /100 | #313 | Tragic $47,159 |
| Chippewa | 0.0 /100 | #314 | Tragic $47,015 |
| Crow | 0.0 /100 | #315 | Tragic $47,012 |
| Sudanese | 0.0 /100 | #316 | Tragic $46,982 |
| Hopi | 0.0 /100 | #317 | Tragic $46,978 |
| Spanish Americans | 0.0 /100 | #318 | Tragic $46,913 |
| Africans | 0.0 /100 | #319 | Tragic $46,838 |