Somali vs Immigrants from Senegal Householder Income Under 25 years
COMPARE
Somali
Immigrants from Senegal
Householder Income Under 25 years
Householder Income Under 25 years Comparison
Somalis
Immigrants from Senegal
$48,657
HOUSEHOLDER INCOME UNDER 25 YEARS
0.0/ 100
METRIC RATING
294th/ 347
METRIC RANK
$49,742
HOUSEHOLDER INCOME UNDER 25 YEARS
0.3/ 100
METRIC RATING
274th/ 347
METRIC RANK
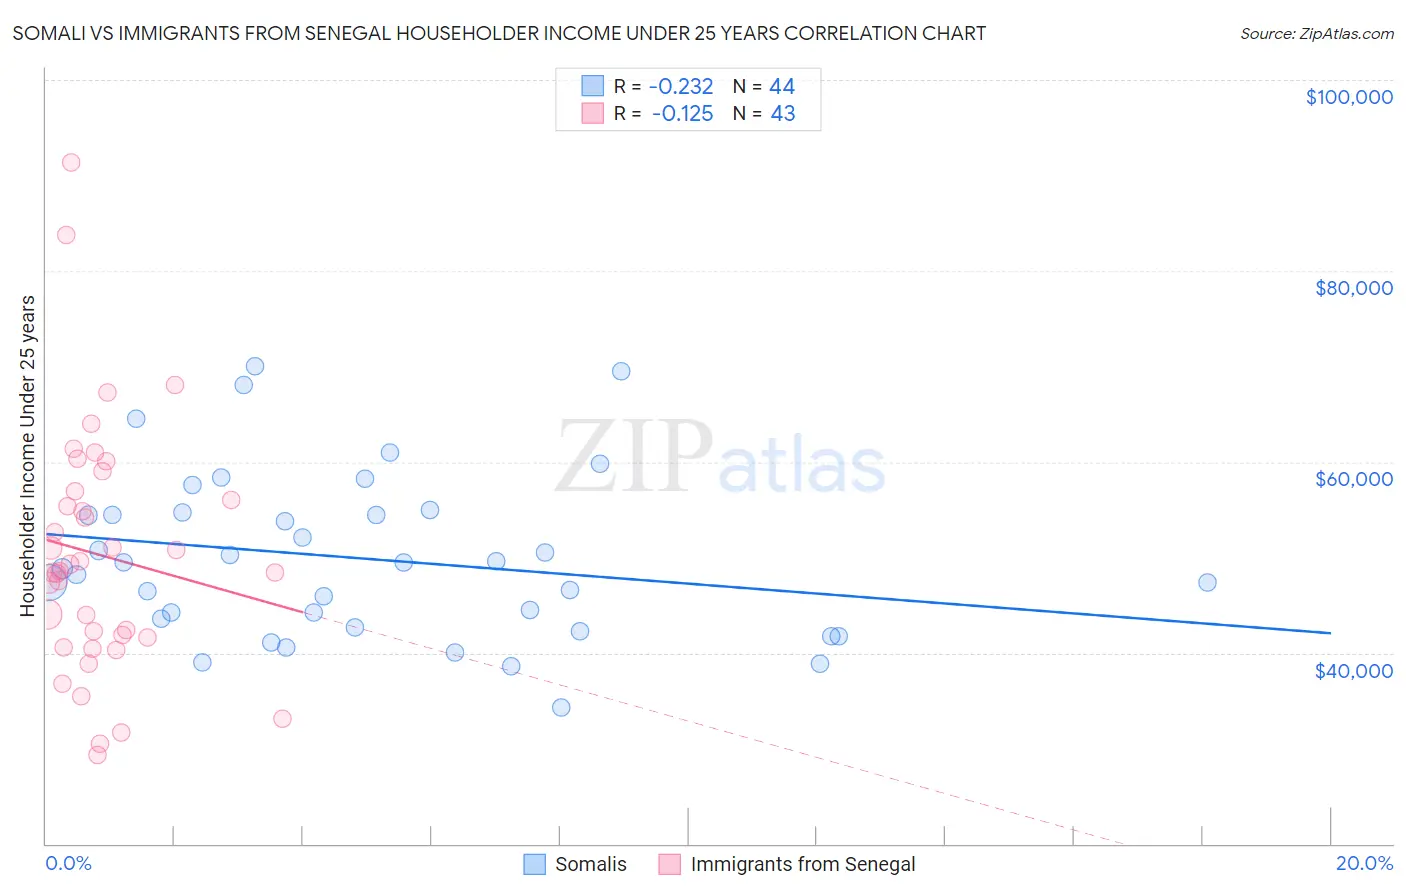
Somali vs Immigrants from Senegal Householder Income Under 25 years Correlation Chart
The statistical analysis conducted on geographies consisting of 95,208,106 people shows a weak negative correlation between the proportion of Somalis and household income with householder under the age of 25 in the United States with a correlation coefficient (R) of -0.232 and weighted average of $48,657. Similarly, the statistical analysis conducted on geographies consisting of 85,448,384 people shows a poor negative correlation between the proportion of Immigrants from Senegal and household income with householder under the age of 25 in the United States with a correlation coefficient (R) of -0.125 and weighted average of $49,742, a difference of 2.2%.
Householder Income Under 25 years Correlation Summary
| Measurement | Somali | Immigrants from Senegal |
| Minimum | $34,250 | $29,259 |
| Maximum | $69,994 | $91,404 |
| Range | $35,744 | $62,145 |
| Mean | $49,862 | $50,222 |
| Median | $49,111 | $48,557 |
| Interquartile 25% (IQ1) | $43,151 | $41,620 |
| Interquartile 75% (IQ3) | $54,604 | $56,900 |
| Interquartile Range (IQR) | $11,452 | $15,280 |
| Standard Deviation (Sample) | $8,614 | $12,847 |
| Standard Deviation (Population) | $8,516 | $12,697 |
Demographics Similar to Somalis and Immigrants from Senegal by Householder Income Under 25 years
In terms of householder income under 25 years, the demographic groups most similar to Somalis are Subsaharan African ($48,691, a difference of 0.070%), Shoshone ($48,720, a difference of 0.13%), Immigrants from Burma/Myanmar ($48,749, a difference of 0.19%), American ($48,860, a difference of 0.42%), and Honduran ($48,885, a difference of 0.47%). Similarly, the demographic groups most similar to Immigrants from Senegal are Immigrants from Kenya ($49,633, a difference of 0.22%), Dominican ($49,633, a difference of 0.22%), Immigrants from Western Africa ($49,621, a difference of 0.24%), Nigerian ($49,416, a difference of 0.66%), and Apache ($49,395, a difference of 0.70%).
| Demographics | Rating | Rank | Householder Income Under 25 years |
| Immigrants | Senegal | 0.3 /100 | #274 | Tragic $49,742 |
| Immigrants | Kenya | 0.2 /100 | #275 | Tragic $49,633 |
| Dominicans | 0.2 /100 | #276 | Tragic $49,633 |
| Immigrants | Western Africa | 0.2 /100 | #277 | Tragic $49,621 |
| Nigerians | 0.1 /100 | #278 | Tragic $49,416 |
| Apache | 0.1 /100 | #279 | Tragic $49,395 |
| Hmong | 0.1 /100 | #280 | Tragic $49,364 |
| Immigrants | Nonimmigrants | 0.1 /100 | #281 | Tragic $49,348 |
| Alsatians | 0.1 /100 | #282 | Tragic $49,267 |
| Immigrants | Nigeria | 0.1 /100 | #283 | Tragic $49,174 |
| Carpatho Rusyns | 0.1 /100 | #284 | Tragic $49,113 |
| Scotch-Irish | 0.0 /100 | #285 | Tragic $49,039 |
| French American Indians | 0.0 /100 | #286 | Tragic $48,977 |
| Senegalese | 0.0 /100 | #287 | Tragic $48,953 |
| Liberians | 0.0 /100 | #288 | Tragic $48,917 |
| Hondurans | 0.0 /100 | #289 | Tragic $48,885 |
| Americans | 0.0 /100 | #290 | Tragic $48,860 |
| Immigrants | Burma/Myanmar | 0.0 /100 | #291 | Tragic $48,749 |
| Shoshone | 0.0 /100 | #292 | Tragic $48,720 |
| Sub-Saharan Africans | 0.0 /100 | #293 | Tragic $48,691 |
| Somalis | 0.0 /100 | #294 | Tragic $48,657 |