Somali vs Immigrants from South America Householder Income Ages 45 - 64 years
COMPARE
Somali
Immigrants from South America
Householder Income Ages 45 - 64 years
Householder Income Ages 45 - 64 years Comparison
Somalis
Immigrants from South America
$88,600
HOUSEHOLDER INCOME AGES 45 - 64 YEARS
0.3/ 100
METRIC RATING
262nd/ 347
METRIC RANK
$99,126
HOUSEHOLDER INCOME AGES 45 - 64 YEARS
35.4/ 100
METRIC RATING
189th/ 347
METRIC RANK
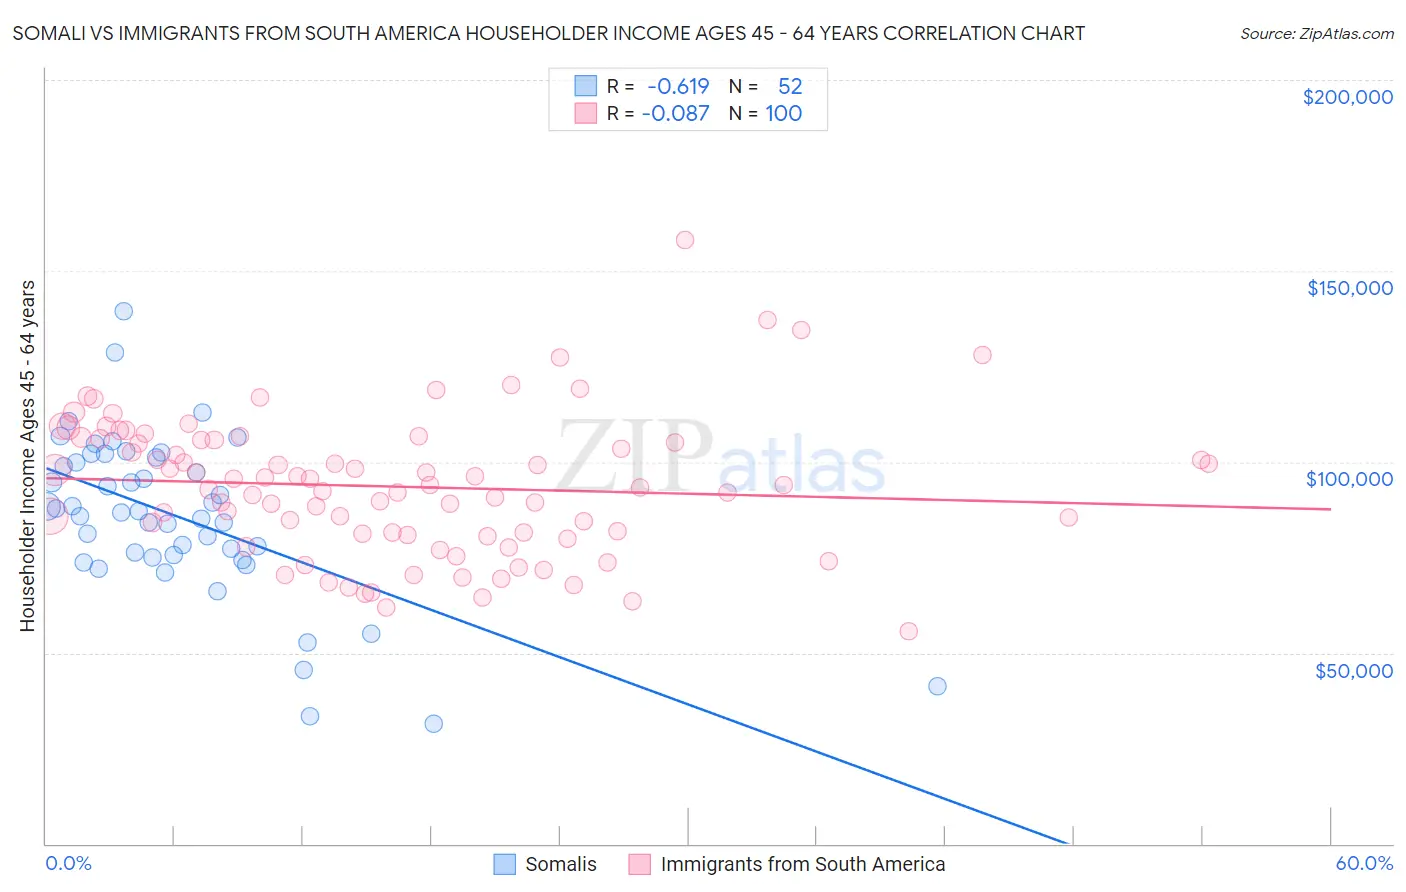
Somali vs Immigrants from South America Householder Income Ages 45 - 64 years Correlation Chart
The statistical analysis conducted on geographies consisting of 99,239,152 people shows a significant negative correlation between the proportion of Somalis and household income with householder between the ages 45 and 64 in the United States with a correlation coefficient (R) of -0.619 and weighted average of $88,600. Similarly, the statistical analysis conducted on geographies consisting of 485,109,583 people shows a slight negative correlation between the proportion of Immigrants from South America and household income with householder between the ages 45 and 64 in the United States with a correlation coefficient (R) of -0.087 and weighted average of $99,126, a difference of 11.9%.
Householder Income Ages 45 - 64 years Correlation Summary
| Measurement | Somali | Immigrants from South America |
| Minimum | $31,458 | $55,625 |
| Maximum | $139,513 | $158,009 |
| Range | $108,055 | $102,384 |
| Mean | $85,624 | $93,526 |
| Median | $86,901 | $93,699 |
| Interquartile 25% (IQ1) | $75,206 | $80,877 |
| Interquartile 75% (IQ3) | $100,414 | $105,801 |
| Interquartile Range (IQR) | $25,208 | $24,923 |
| Standard Deviation (Sample) | $21,267 | $18,231 |
| Standard Deviation (Population) | $21,061 | $18,139 |
Similar Demographics by Householder Income Ages 45 - 64 years
Demographics Similar to Somalis by Householder Income Ages 45 - 64 years
In terms of householder income ages 45 - 64 years, the demographic groups most similar to Somalis are Belizean ($88,684, a difference of 0.090%), Immigrants from Senegal ($88,421, a difference of 0.20%), Osage ($88,390, a difference of 0.24%), Jamaican ($88,327, a difference of 0.31%), and Liberian ($88,929, a difference of 0.37%).
| Demographics | Rating | Rank | Householder Income Ages 45 - 64 years |
| West Indians | 0.5 /100 | #255 | Tragic $89,906 |
| French American Indians | 0.5 /100 | #256 | Tragic $89,811 |
| German Russians | 0.4 /100 | #257 | Tragic $89,398 |
| Immigrants | Barbados | 0.4 /100 | #258 | Tragic $89,394 |
| Immigrants | Nicaragua | 0.4 /100 | #259 | Tragic $89,108 |
| Liberians | 0.3 /100 | #260 | Tragic $88,929 |
| Belizeans | 0.3 /100 | #261 | Tragic $88,684 |
| Somalis | 0.3 /100 | #262 | Tragic $88,600 |
| Immigrants | Senegal | 0.3 /100 | #263 | Tragic $88,421 |
| Osage | 0.3 /100 | #264 | Tragic $88,390 |
| Jamaicans | 0.2 /100 | #265 | Tragic $88,327 |
| Immigrants | West Indies | 0.2 /100 | #266 | Tragic $88,164 |
| Hmong | 0.2 /100 | #267 | Tragic $88,115 |
| Immigrants | Micronesia | 0.2 /100 | #268 | Tragic $87,864 |
| Spanish Americans | 0.2 /100 | #269 | Tragic $87,836 |
Demographics Similar to Immigrants from South America by Householder Income Ages 45 - 64 years
In terms of householder income ages 45 - 64 years, the demographic groups most similar to Immigrants from South America are French Canadian ($99,093, a difference of 0.030%), Immigrants from Portugal ($99,203, a difference of 0.080%), Kenyan ($98,970, a difference of 0.16%), Celtic ($98,896, a difference of 0.23%), and Iraqi ($99,387, a difference of 0.26%).
| Demographics | Rating | Rank | Householder Income Ages 45 - 64 years |
| Finns | 44.8 /100 | #182 | Average $99,904 |
| Spaniards | 44.6 /100 | #183 | Average $99,889 |
| French | 43.8 /100 | #184 | Average $99,824 |
| Colombians | 43.2 /100 | #185 | Average $99,772 |
| Dutch | 41.7 /100 | #186 | Average $99,650 |
| Iraqis | 38.5 /100 | #187 | Fair $99,387 |
| Immigrants | Portugal | 36.3 /100 | #188 | Fair $99,203 |
| Immigrants | South America | 35.4 /100 | #189 | Fair $99,126 |
| French Canadians | 35.1 /100 | #190 | Fair $99,093 |
| Kenyans | 33.7 /100 | #191 | Fair $98,970 |
| Celtics | 32.9 /100 | #192 | Fair $98,896 |
| Hawaiians | 31.6 /100 | #193 | Fair $98,778 |
| Uruguayans | 30.3 /100 | #194 | Fair $98,660 |
| Spanish | 29.2 /100 | #195 | Fair $98,554 |
| Immigrants | Eastern Africa | 28.3 /100 | #196 | Fair $98,467 |