Peruvian vs Alaska Native Householder Income Ages 45 - 64 years
COMPARE
Peruvian
Alaska Native
Householder Income Ages 45 - 64 years
Householder Income Ages 45 - 64 years Comparison
Peruvians
Alaska Natives
$105,070
HOUSEHOLDER INCOME AGES 45 - 64 YEARS
91.5/ 100
METRIC RATING
129th/ 347
METRIC RANK
$93,991
HOUSEHOLDER INCOME AGES 45 - 64 YEARS
4.0/ 100
METRIC RATING
227th/ 347
METRIC RANK
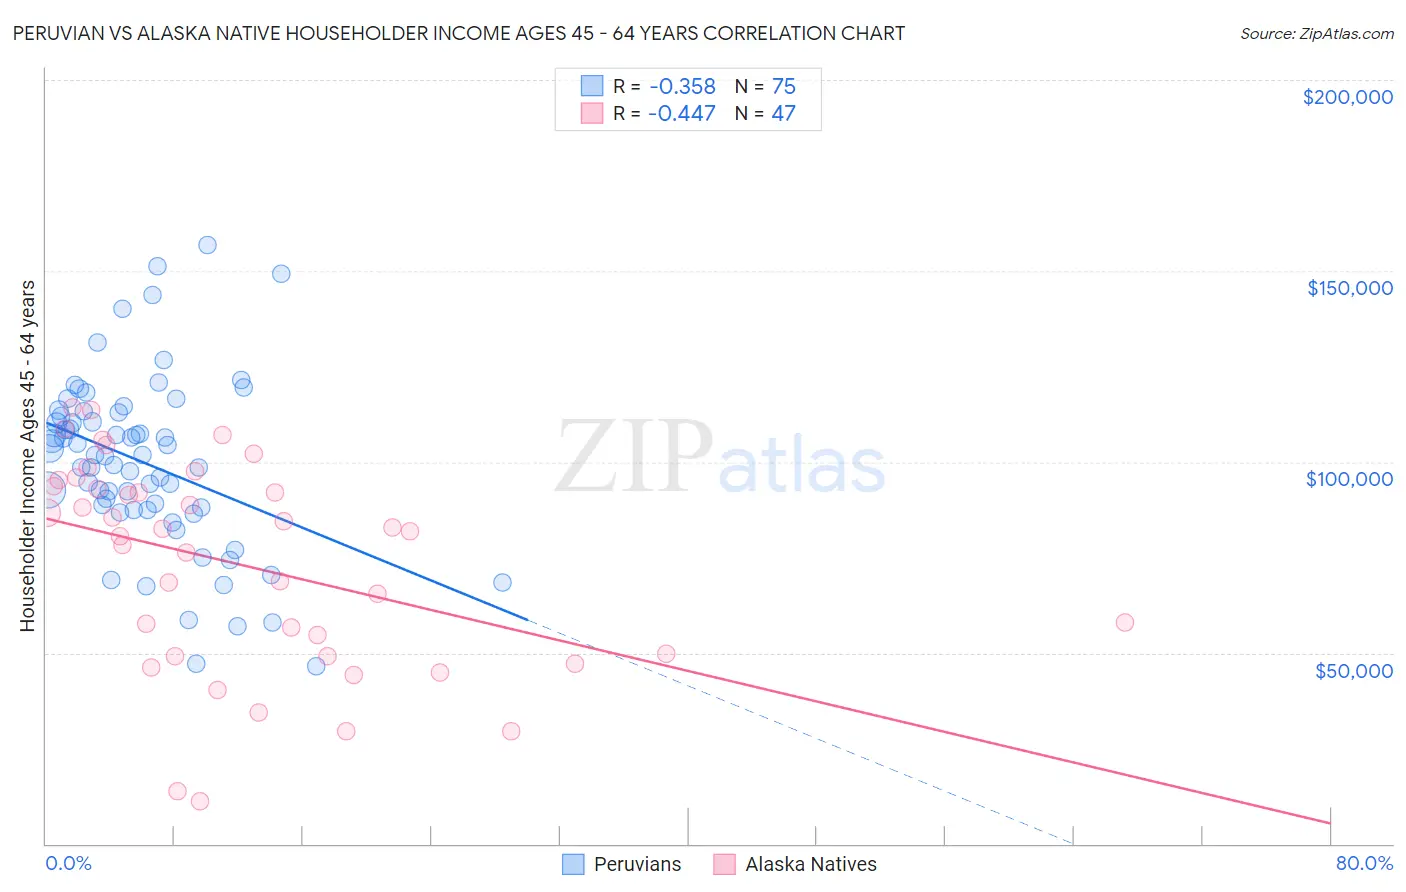
Peruvian vs Alaska Native Householder Income Ages 45 - 64 years Correlation Chart
The statistical analysis conducted on geographies consisting of 362,640,242 people shows a mild negative correlation between the proportion of Peruvians and household income with householder between the ages 45 and 64 in the United States with a correlation coefficient (R) of -0.358 and weighted average of $105,070. Similarly, the statistical analysis conducted on geographies consisting of 76,694,655 people shows a moderate negative correlation between the proportion of Alaska Natives and household income with householder between the ages 45 and 64 in the United States with a correlation coefficient (R) of -0.447 and weighted average of $93,991, a difference of 11.8%.
Householder Income Ages 45 - 64 years Correlation Summary
| Measurement | Peruvian | Alaska Native |
| Minimum | $46,375 | $11,250 |
| Maximum | $156,818 | $114,284 |
| Range | $110,443 | $103,034 |
| Mean | $99,765 | $73,165 |
| Median | $101,930 | $81,875 |
| Interquartile 25% (IQ1) | $87,436 | $49,167 |
| Interquartile 75% (IQ3) | $112,777 | $93,652 |
| Interquartile Range (IQR) | $25,341 | $44,485 |
| Standard Deviation (Sample) | $22,661 | $27,050 |
| Standard Deviation (Population) | $22,510 | $26,761 |
Similar Demographics by Householder Income Ages 45 - 64 years
Demographics Similar to Peruvians by Householder Income Ages 45 - 64 years
In terms of householder income ages 45 - 64 years, the demographic groups most similar to Peruvians are Immigrants from Zimbabwe ($104,992, a difference of 0.070%), Native Hawaiian ($105,149, a difference of 0.080%), Immigrants from Saudi Arabia ($105,249, a difference of 0.17%), Immigrants from Syria ($104,858, a difference of 0.20%), and Pakistani ($105,317, a difference of 0.23%).
| Demographics | Rating | Rank | Householder Income Ages 45 - 64 years |
| Immigrants | North Macedonia | 94.2 /100 | #122 | Exceptional $105,892 |
| Danes | 93.4 /100 | #123 | Exceptional $105,619 |
| Immigrants | Northern Africa | 92.8 /100 | #124 | Exceptional $105,430 |
| Pakistanis | 92.4 /100 | #125 | Exceptional $105,317 |
| Portuguese | 92.4 /100 | #126 | Exceptional $105,309 |
| Immigrants | Saudi Arabia | 92.2 /100 | #127 | Exceptional $105,249 |
| Native Hawaiians | 91.8 /100 | #128 | Exceptional $105,149 |
| Peruvians | 91.5 /100 | #129 | Exceptional $105,070 |
| Immigrants | Zimbabwe | 91.2 /100 | #130 | Exceptional $104,992 |
| Immigrants | Syria | 90.7 /100 | #131 | Exceptional $104,858 |
| Lebanese | 90.1 /100 | #132 | Exceptional $104,734 |
| Arabs | 89.3 /100 | #133 | Excellent $104,566 |
| Canadians | 89.3 /100 | #134 | Excellent $104,560 |
| Brazilians | 88.6 /100 | #135 | Excellent $104,408 |
| Taiwanese | 87.4 /100 | #136 | Excellent $104,180 |
Demographics Similar to Alaska Natives by Householder Income Ages 45 - 64 years
In terms of householder income ages 45 - 64 years, the demographic groups most similar to Alaska Natives are Immigrants from the Azores ($94,138, a difference of 0.16%), Immigrants from Panama ($93,815, a difference of 0.19%), Bermudan ($94,197, a difference of 0.22%), Vietnamese ($93,788, a difference of 0.22%), and Immigrants from Sudan ($93,781, a difference of 0.22%).
| Demographics | Rating | Rank | Householder Income Ages 45 - 64 years |
| Salvadorans | 6.0 /100 | #220 | Tragic $94,842 |
| Immigrants | Nigeria | 5.9 /100 | #221 | Tragic $94,804 |
| Malaysians | 5.2 /100 | #222 | Tragic $94,517 |
| Immigrants | Nonimmigrants | 5.0 /100 | #223 | Tragic $94,448 |
| Immigrants | Bosnia and Herzegovina | 4.6 /100 | #224 | Tragic $94,288 |
| Bermudans | 4.4 /100 | #225 | Tragic $94,197 |
| Immigrants | Azores | 4.3 /100 | #226 | Tragic $94,138 |
| Alaska Natives | 4.0 /100 | #227 | Tragic $93,991 |
| Immigrants | Panama | 3.7 /100 | #228 | Tragic $93,815 |
| Vietnamese | 3.6 /100 | #229 | Tragic $93,788 |
| Immigrants | Sudan | 3.6 /100 | #230 | Tragic $93,781 |
| Ecuadorians | 3.6 /100 | #231 | Tragic $93,739 |
| Sudanese | 3.5 /100 | #232 | Tragic $93,718 |
| Nepalese | 3.0 /100 | #233 | Tragic $93,355 |
| Immigrants | El Salvador | 2.7 /100 | #234 | Tragic $93,176 |