Slovene vs Ethiopian Median Household Income
COMPARE
Slovene
Ethiopian
Median Household Income
Median Household Income Comparison
Slovenes
Ethiopians
$85,562
MEDIAN HOUSEHOLD INCOME
57.4/ 100
METRIC RATING
172nd/ 347
METRIC RANK
$89,640
MEDIAN HOUSEHOLD INCOME
94.9/ 100
METRIC RATING
121st/ 347
METRIC RANK
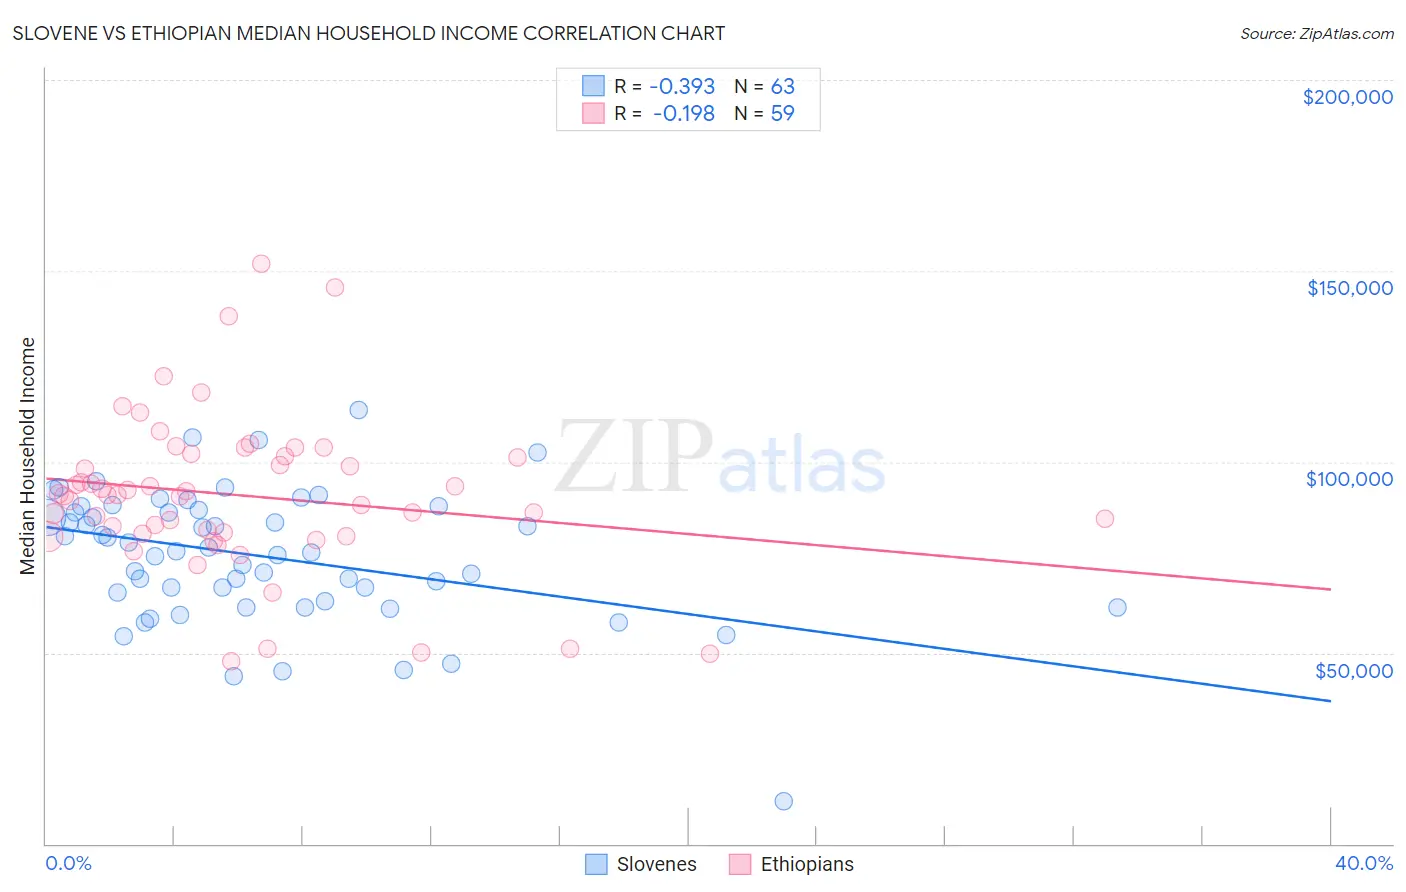
Slovene vs Ethiopian Median Household Income Correlation Chart
The statistical analysis conducted on geographies consisting of 261,226,883 people shows a mild negative correlation between the proportion of Slovenes and median household income in the United States with a correlation coefficient (R) of -0.393 and weighted average of $85,562. Similarly, the statistical analysis conducted on geographies consisting of 223,045,474 people shows a poor negative correlation between the proportion of Ethiopians and median household income in the United States with a correlation coefficient (R) of -0.198 and weighted average of $89,640, a difference of 4.8%.
Median Household Income Correlation Summary
| Measurement | Slovene | Ethiopian |
| Minimum | $11,161 | $47,668 |
| Maximum | $113,650 | $151,943 |
| Range | $102,489 | $104,275 |
| Mean | $75,280 | $91,215 |
| Median | $76,693 | $91,248 |
| Interquartile 25% (IQ1) | $63,438 | $81,124 |
| Interquartile 75% (IQ3) | $87,449 | $101,374 |
| Interquartile Range (IQR) | $24,011 | $20,250 |
| Standard Deviation (Sample) | $17,550 | $20,515 |
| Standard Deviation (Population) | $17,410 | $20,340 |
Similar Demographics by Median Household Income
Demographics Similar to Slovenes by Median Household Income
In terms of median household income, the demographic groups most similar to Slovenes are Immigrants from South America ($85,611, a difference of 0.060%), Swiss ($85,681, a difference of 0.14%), Colombian ($85,716, a difference of 0.18%), Icelander ($85,797, a difference of 0.27%), and Immigrants from Cameroon ($85,314, a difference of 0.29%).
| Demographics | Rating | Rank | Median Household Income |
| Norwegians | 65.3 /100 | #165 | Good $86,084 |
| Scandinavians | 65.1 /100 | #166 | Good $86,073 |
| Immigrants | Immigrants | 61.3 /100 | #167 | Good $85,818 |
| Icelanders | 61.0 /100 | #168 | Good $85,797 |
| Colombians | 59.7 /100 | #169 | Average $85,716 |
| Swiss | 59.2 /100 | #170 | Average $85,681 |
| Immigrants | South America | 58.1 /100 | #171 | Average $85,611 |
| Slovenes | 57.4 /100 | #172 | Average $85,562 |
| Immigrants | Cameroon | 53.4 /100 | #173 | Average $85,314 |
| Scottish | 50.0 /100 | #174 | Average $85,101 |
| Immigrants | Costa Rica | 49.2 /100 | #175 | Average $85,054 |
| Alsatians | 49.2 /100 | #176 | Average $85,053 |
| Immigrants | Eritrea | 48.8 /100 | #177 | Average $85,025 |
| Czechoslovakians | 47.8 /100 | #178 | Average $84,965 |
| English | 47.0 /100 | #179 | Average $84,915 |
Demographics Similar to Ethiopians by Median Household Income
In terms of median household income, the demographic groups most similar to Ethiopians are Pakistani ($89,638, a difference of 0.0%), Immigrants from North Macedonia ($89,741, a difference of 0.11%), Albanian ($89,744, a difference of 0.12%), Immigrants from Zimbabwe ($89,496, a difference of 0.16%), and Syrian ($89,830, a difference of 0.21%).
| Demographics | Rating | Rank | Median Household Income |
| Immigrants | Northern Africa | 95.9 /100 | #114 | Exceptional $90,026 |
| Immigrants | Western Asia | 95.9 /100 | #115 | Exceptional $90,005 |
| Native Hawaiians | 95.7 /100 | #116 | Exceptional $89,919 |
| Taiwanese | 95.6 /100 | #117 | Exceptional $89,900 |
| Syrians | 95.4 /100 | #118 | Exceptional $89,830 |
| Albanians | 95.2 /100 | #119 | Exceptional $89,744 |
| Immigrants | North Macedonia | 95.2 /100 | #120 | Exceptional $89,741 |
| Ethiopians | 94.9 /100 | #121 | Exceptional $89,640 |
| Pakistanis | 94.8 /100 | #122 | Exceptional $89,638 |
| Immigrants | Zimbabwe | 94.4 /100 | #123 | Exceptional $89,496 |
| Immigrants | Jordan | 94.1 /100 | #124 | Exceptional $89,412 |
| Immigrants | Kuwait | 93.5 /100 | #125 | Exceptional $89,263 |
| Immigrants | Oceania | 92.9 /100 | #126 | Exceptional $89,100 |
| Immigrants | Peru | 92.5 /100 | #127 | Exceptional $89,010 |
| Portuguese | 92.3 /100 | #128 | Exceptional $88,976 |