Slovene vs Czech Median Family Income
COMPARE
Slovene
Czech
Median Family Income
Median Family Income Comparison
Slovenes
Czechs
$106,020
MEDIAN FAMILY INCOME
84.7/ 100
METRIC RATING
142nd/ 347
METRIC RANK
$105,839
MEDIAN FAMILY INCOME
83.4/ 100
METRIC RATING
146th/ 347
METRIC RANK
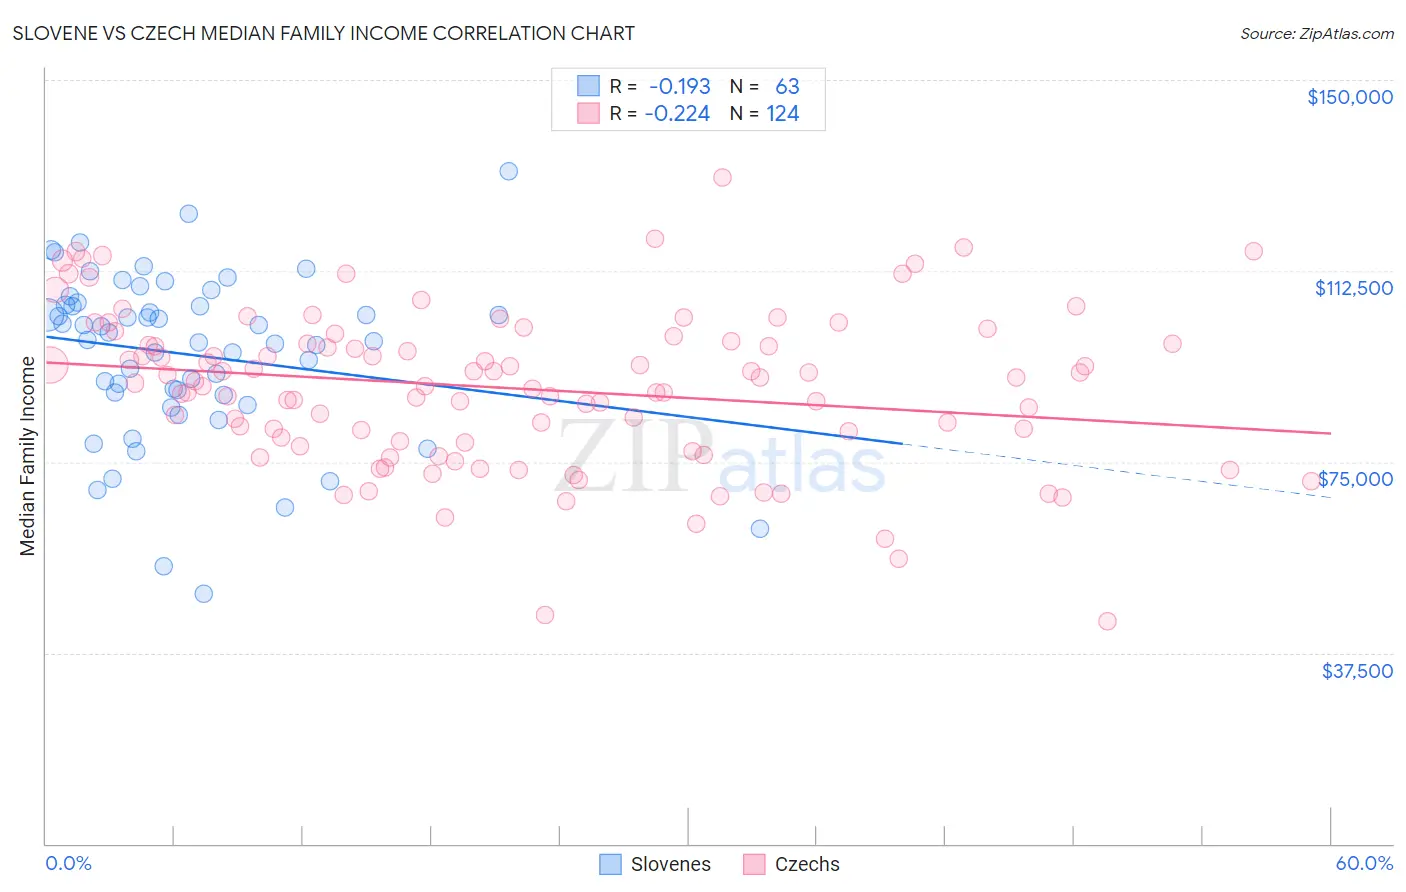
Slovene vs Czech Median Family Income Correlation Chart
The statistical analysis conducted on geographies consisting of 261,214,906 people shows a poor negative correlation between the proportion of Slovenes and median family income in the United States with a correlation coefficient (R) of -0.193 and weighted average of $106,020. Similarly, the statistical analysis conducted on geographies consisting of 484,215,939 people shows a weak negative correlation between the proportion of Czechs and median family income in the United States with a correlation coefficient (R) of -0.224 and weighted average of $105,839, a difference of 0.17%.
Median Family Income Correlation Summary
| Measurement | Slovene | Czech |
| Minimum | $48,984 | $43,750 |
| Maximum | $132,096 | $130,730 |
| Range | $83,112 | $86,980 |
| Mean | $96,087 | $89,458 |
| Median | $98,910 | $90,621 |
| Interquartile 25% (IQ1) | $88,135 | $79,002 |
| Interquartile 75% (IQ3) | $105,910 | $98,480 |
| Interquartile Range (IQR) | $17,775 | $19,478 |
| Standard Deviation (Sample) | $16,283 | $15,413 |
| Standard Deviation (Population) | $16,153 | $15,350 |
Demographics Similar to Slovenes and Czechs by Median Family Income
In terms of median family income, the demographic groups most similar to Slovenes are Tongan ($105,967, a difference of 0.050%), Immigrants from Morocco ($105,964, a difference of 0.050%), Immigrants from Syria ($106,118, a difference of 0.090%), Danish ($105,900, a difference of 0.11%), and Norwegian ($106,144, a difference of 0.12%). Similarly, the demographic groups most similar to Czechs are Danish ($105,900, a difference of 0.060%), Tongan ($105,967, a difference of 0.12%), Immigrants from Morocco ($105,964, a difference of 0.12%), Immigrants from Chile ($105,655, a difference of 0.17%), and Hungarian ($105,609, a difference of 0.22%).
| Demographics | Rating | Rank | Median Family Income |
| Immigrants | Oceania | 87.3 /100 | #134 | Excellent $106,453 |
| Portuguese | 86.3 /100 | #135 | Excellent $106,286 |
| Immigrants | South Eastern Asia | 86.1 /100 | #136 | Excellent $106,252 |
| Immigrants | Uganda | 85.7 /100 | #137 | Excellent $106,188 |
| Immigrants | Vietnam | 85.7 /100 | #138 | Excellent $106,186 |
| Luxembourgers | 85.7 /100 | #139 | Excellent $106,183 |
| Norwegians | 85.5 /100 | #140 | Excellent $106,144 |
| Immigrants | Syria | 85.3 /100 | #141 | Excellent $106,118 |
| Slovenes | 84.7 /100 | #142 | Excellent $106,020 |
| Tongans | 84.3 /100 | #143 | Excellent $105,967 |
| Immigrants | Morocco | 84.3 /100 | #144 | Excellent $105,964 |
| Danes | 83.8 /100 | #145 | Excellent $105,900 |
| Czechs | 83.4 /100 | #146 | Excellent $105,839 |
| Immigrants | Chile | 82.1 /100 | #147 | Excellent $105,655 |
| Hungarians | 81.7 /100 | #148 | Excellent $105,609 |
| Immigrants | Germany | 80.9 /100 | #149 | Excellent $105,507 |
| Irish | 80.5 /100 | #150 | Excellent $105,453 |
| Peruvians | 80.4 /100 | #151 | Excellent $105,444 |
| Immigrants | Albania | 79.1 /100 | #152 | Good $105,285 |
| Slavs | 77.9 /100 | #153 | Good $105,144 |
| Immigrants | Nepal | 76.3 /100 | #154 | Good $104,966 |