Immigrants from Peru vs Taiwanese Median Household Income
COMPARE
Immigrants from Peru
Taiwanese
Median Household Income
Median Household Income Comparison
Immigrants from Peru
Taiwanese
$89,010
MEDIAN HOUSEHOLD INCOME
92.5/ 100
METRIC RATING
127th/ 347
METRIC RANK
$89,900
MEDIAN HOUSEHOLD INCOME
95.6/ 100
METRIC RATING
117th/ 347
METRIC RANK
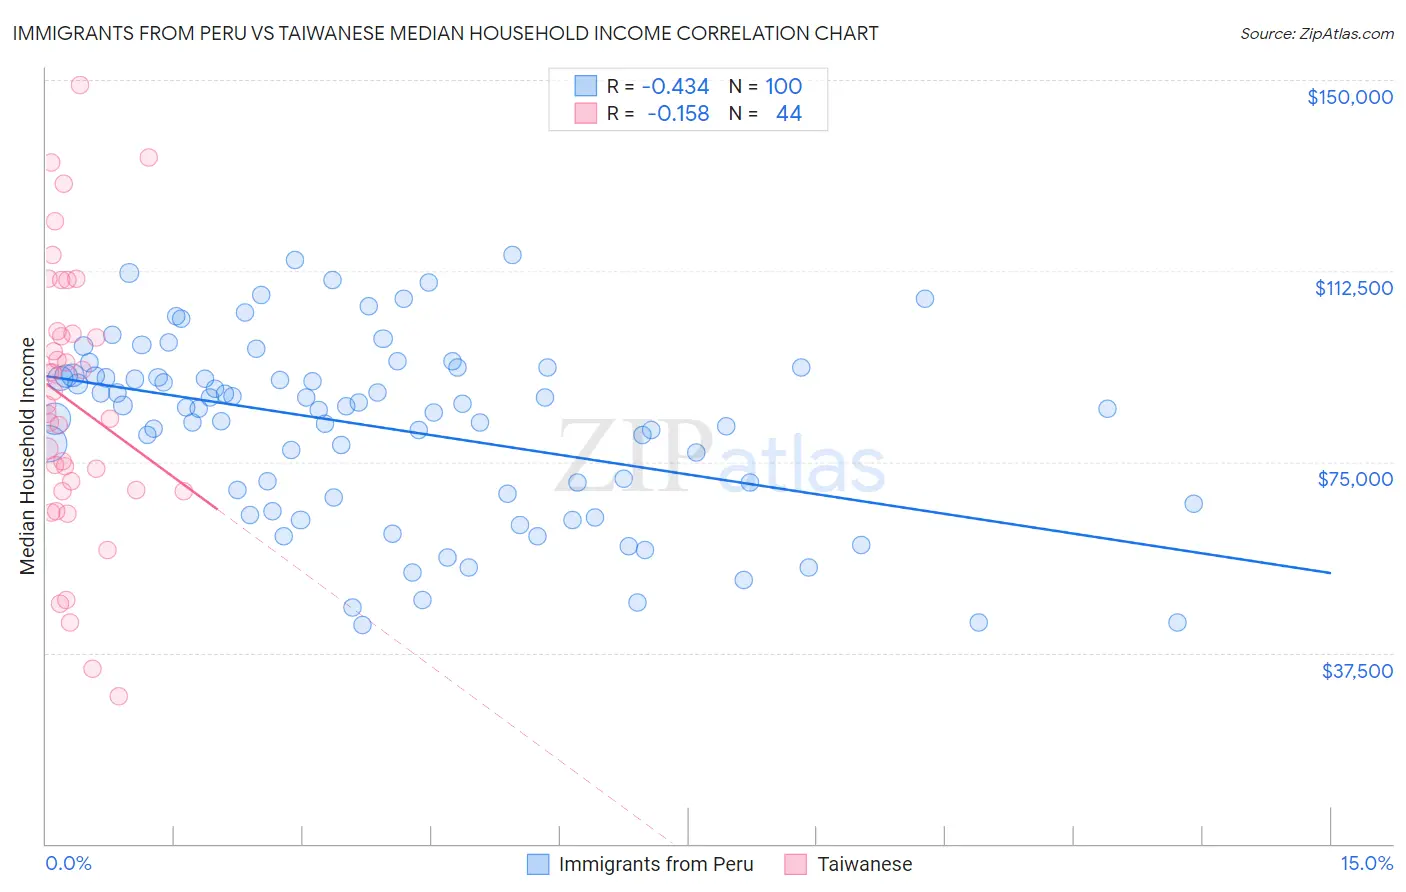
Immigrants from Peru vs Taiwanese Median Household Income Correlation Chart
The statistical analysis conducted on geographies consisting of 328,713,942 people shows a moderate negative correlation between the proportion of Immigrants from Peru and median household income in the United States with a correlation coefficient (R) of -0.434 and weighted average of $89,010. Similarly, the statistical analysis conducted on geographies consisting of 31,709,765 people shows a poor negative correlation between the proportion of Taiwanese and median household income in the United States with a correlation coefficient (R) of -0.158 and weighted average of $89,900, a difference of 1.0%.
Median Household Income Correlation Summary
| Measurement | Immigrants from Peru | Taiwanese |
| Minimum | $42,917 | $29,038 |
| Maximum | $115,592 | $149,028 |
| Range | $72,675 | $119,990 |
| Mean | $81,696 | $86,573 |
| Median | $85,578 | $85,327 |
| Interquartile 25% (IQ1) | $68,327 | $69,445 |
| Interquartile 75% (IQ3) | $91,955 | $100,383 |
| Interquartile Range (IQR) | $23,628 | $30,938 |
| Standard Deviation (Sample) | $17,705 | $26,800 |
| Standard Deviation (Population) | $17,616 | $26,494 |
Demographics Similar to Immigrants from Peru and Taiwanese by Median Household Income
In terms of median household income, the demographic groups most similar to Immigrants from Peru are Portuguese ($88,976, a difference of 0.040%), Brazilian ($88,934, a difference of 0.090%), Immigrants from Oceania ($89,100, a difference of 0.10%), British ($88,914, a difference of 0.11%), and Immigrants from Syria ($88,792, a difference of 0.25%). Similarly, the demographic groups most similar to Taiwanese are Native Hawaiian ($89,919, a difference of 0.020%), Syrian ($89,830, a difference of 0.080%), Immigrants from Western Asia ($90,005, a difference of 0.12%), Immigrants from Northern Africa ($90,026, a difference of 0.14%), and Albanian ($89,744, a difference of 0.17%).
| Demographics | Rating | Rank | Median Household Income |
| Northern Europeans | 96.9 /100 | #112 | Exceptional $90,446 |
| Peruvians | 96.5 /100 | #113 | Exceptional $90,261 |
| Immigrants | Northern Africa | 95.9 /100 | #114 | Exceptional $90,026 |
| Immigrants | Western Asia | 95.9 /100 | #115 | Exceptional $90,005 |
| Native Hawaiians | 95.7 /100 | #116 | Exceptional $89,919 |
| Taiwanese | 95.6 /100 | #117 | Exceptional $89,900 |
| Syrians | 95.4 /100 | #118 | Exceptional $89,830 |
| Albanians | 95.2 /100 | #119 | Exceptional $89,744 |
| Immigrants | North Macedonia | 95.2 /100 | #120 | Exceptional $89,741 |
| Ethiopians | 94.9 /100 | #121 | Exceptional $89,640 |
| Pakistanis | 94.8 /100 | #122 | Exceptional $89,638 |
| Immigrants | Zimbabwe | 94.4 /100 | #123 | Exceptional $89,496 |
| Immigrants | Jordan | 94.1 /100 | #124 | Exceptional $89,412 |
| Immigrants | Kuwait | 93.5 /100 | #125 | Exceptional $89,263 |
| Immigrants | Oceania | 92.9 /100 | #126 | Exceptional $89,100 |
| Immigrants | Peru | 92.5 /100 | #127 | Exceptional $89,010 |
| Portuguese | 92.3 /100 | #128 | Exceptional $88,976 |
| Brazilians | 92.1 /100 | #129 | Exceptional $88,934 |
| British | 92.0 /100 | #130 | Exceptional $88,914 |
| Immigrants | Syria | 91.4 /100 | #131 | Exceptional $88,792 |
| Europeans | 91.2 /100 | #132 | Exceptional $88,751 |