Immigrants from Northern Europe vs Taiwanese Median Household Income
COMPARE
Immigrants from Northern Europe
Taiwanese
Median Household Income
Median Household Income Comparison
Immigrants from Northern Europe
Taiwanese
$99,813
MEDIAN HOUSEHOLD INCOME
100.0/ 100
METRIC RATING
30th/ 347
METRIC RANK
$89,900
MEDIAN HOUSEHOLD INCOME
95.6/ 100
METRIC RATING
117th/ 347
METRIC RANK
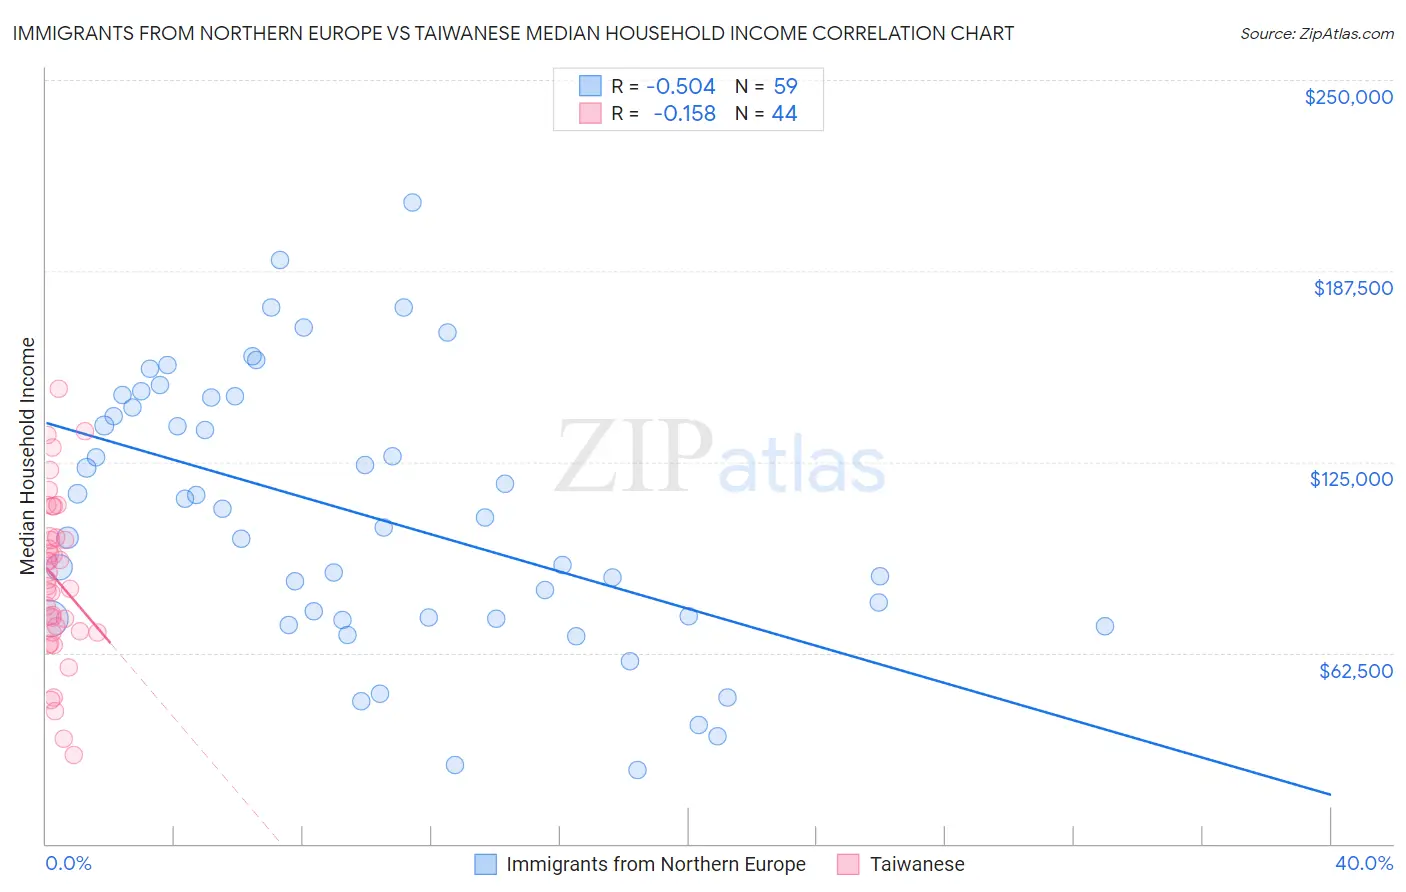
Immigrants from Northern Europe vs Taiwanese Median Household Income Correlation Chart
The statistical analysis conducted on geographies consisting of 476,802,957 people shows a substantial negative correlation between the proportion of Immigrants from Northern Europe and median household income in the United States with a correlation coefficient (R) of -0.504 and weighted average of $99,813. Similarly, the statistical analysis conducted on geographies consisting of 31,709,765 people shows a poor negative correlation between the proportion of Taiwanese and median household income in the United States with a correlation coefficient (R) of -0.158 and weighted average of $89,900, a difference of 11.0%.
Median Household Income Correlation Summary
| Measurement | Immigrants from Northern Europe | Taiwanese |
| Minimum | $24,028 | $29,038 |
| Maximum | $209,716 | $149,028 |
| Range | $185,688 | $119,990 |
| Mean | $107,993 | $86,573 |
| Median | $106,962 | $85,327 |
| Interquartile 25% (IQ1) | $73,842 | $69,445 |
| Interquartile 75% (IQ3) | $145,929 | $100,383 |
| Interquartile Range (IQR) | $72,086 | $30,938 |
| Standard Deviation (Sample) | $43,756 | $26,800 |
| Standard Deviation (Population) | $43,384 | $26,494 |
Similar Demographics by Median Household Income
Demographics Similar to Immigrants from Northern Europe by Median Household Income
In terms of median household income, the demographic groups most similar to Immigrants from Northern Europe are Immigrants from Asia ($99,933, a difference of 0.12%), Immigrants from Sri Lanka ($99,943, a difference of 0.13%), Bhutanese ($100,151, a difference of 0.34%), Turkish ($99,389, a difference of 0.43%), and Immigrants from Belgium ($100,306, a difference of 0.49%).
| Demographics | Rating | Rank | Median Household Income |
| Immigrants | Bolivia | 100.0 /100 | #23 | Exceptional $101,394 |
| Immigrants | Japan | 100.0 /100 | #24 | Exceptional $100,711 |
| Immigrants | Sweden | 100.0 /100 | #25 | Exceptional $100,699 |
| Immigrants | Belgium | 100.0 /100 | #26 | Exceptional $100,306 |
| Bhutanese | 100.0 /100 | #27 | Exceptional $100,151 |
| Immigrants | Sri Lanka | 100.0 /100 | #28 | Exceptional $99,943 |
| Immigrants | Asia | 100.0 /100 | #29 | Exceptional $99,933 |
| Immigrants | Northern Europe | 100.0 /100 | #30 | Exceptional $99,813 |
| Turks | 100.0 /100 | #31 | Exceptional $99,389 |
| Immigrants | Denmark | 100.0 /100 | #32 | Exceptional $98,510 |
| Chinese | 100.0 /100 | #33 | Exceptional $98,496 |
| Russians | 100.0 /100 | #34 | Exceptional $98,008 |
| Immigrants | Switzerland | 100.0 /100 | #35 | Exceptional $97,979 |
| Immigrants | Pakistan | 100.0 /100 | #36 | Exceptional $97,528 |
| Latvians | 100.0 /100 | #37 | Exceptional $97,311 |
Demographics Similar to Taiwanese by Median Household Income
In terms of median household income, the demographic groups most similar to Taiwanese are Native Hawaiian ($89,919, a difference of 0.020%), Syrian ($89,830, a difference of 0.080%), Immigrants from Western Asia ($90,005, a difference of 0.12%), Immigrants from Northern Africa ($90,026, a difference of 0.14%), and Albanian ($89,744, a difference of 0.17%).
| Demographics | Rating | Rank | Median Household Income |
| Palestinians | 97.1 /100 | #110 | Exceptional $90,574 |
| Immigrants | Poland | 97.1 /100 | #111 | Exceptional $90,549 |
| Northern Europeans | 96.9 /100 | #112 | Exceptional $90,446 |
| Peruvians | 96.5 /100 | #113 | Exceptional $90,261 |
| Immigrants | Northern Africa | 95.9 /100 | #114 | Exceptional $90,026 |
| Immigrants | Western Asia | 95.9 /100 | #115 | Exceptional $90,005 |
| Native Hawaiians | 95.7 /100 | #116 | Exceptional $89,919 |
| Taiwanese | 95.6 /100 | #117 | Exceptional $89,900 |
| Syrians | 95.4 /100 | #118 | Exceptional $89,830 |
| Albanians | 95.2 /100 | #119 | Exceptional $89,744 |
| Immigrants | North Macedonia | 95.2 /100 | #120 | Exceptional $89,741 |
| Ethiopians | 94.9 /100 | #121 | Exceptional $89,640 |
| Pakistanis | 94.8 /100 | #122 | Exceptional $89,638 |
| Immigrants | Zimbabwe | 94.4 /100 | #123 | Exceptional $89,496 |
| Immigrants | Jordan | 94.1 /100 | #124 | Exceptional $89,412 |