Nigerian vs Nepalese Median Male Earnings
COMPARE
Nigerian
Nepalese
Median Male Earnings
Median Male Earnings Comparison
Nigerians
Nepalese
$52,039
MEDIAN MALE EARNINGS
8.3/ 100
METRIC RATING
217th/ 347
METRIC RANK
$49,458
MEDIAN MALE EARNINGS
0.7/ 100
METRIC RATING
259th/ 347
METRIC RANK
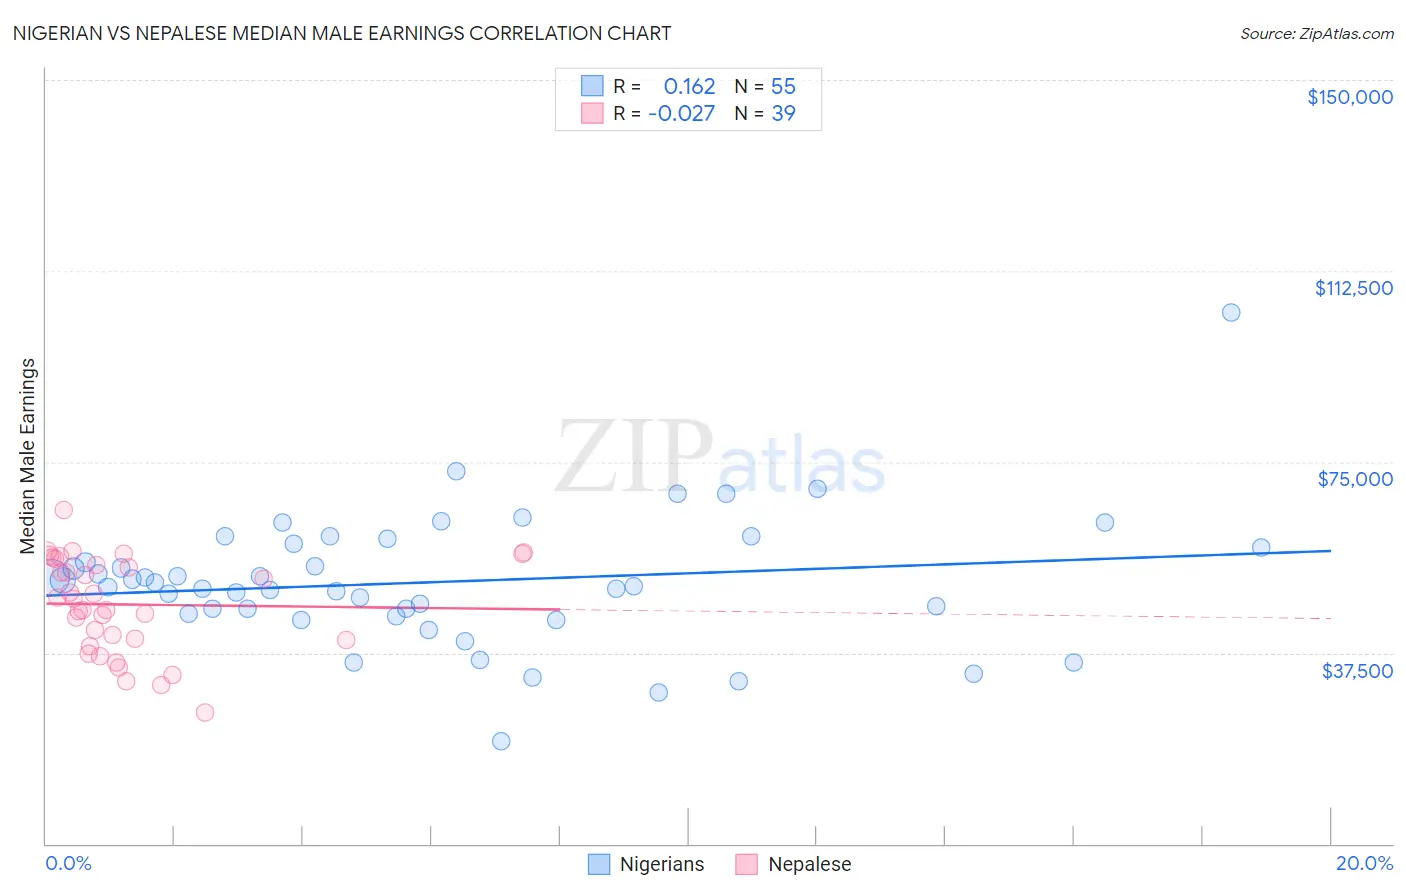
Nigerian vs Nepalese Median Male Earnings Correlation Chart
The statistical analysis conducted on geographies consisting of 332,727,024 people shows a poor positive correlation between the proportion of Nigerians and median male earnings in the United States with a correlation coefficient (R) of 0.162 and weighted average of $52,039. Similarly, the statistical analysis conducted on geographies consisting of 24,431,712 people shows no correlation between the proportion of Nepalese and median male earnings in the United States with a correlation coefficient (R) of -0.027 and weighted average of $49,458, a difference of 5.2%.
Median Male Earnings Correlation Summary
| Measurement | Nigerian | Nepalese |
| Minimum | $20,187 | $25,893 |
| Maximum | $104,375 | $65,607 |
| Range | $84,188 | $39,714 |
| Mean | $51,399 | $46,984 |
| Median | $50,552 | $48,060 |
| Interquartile 25% (IQ1) | $45,099 | $40,000 |
| Interquartile 75% (IQ3) | $58,900 | $56,086 |
| Interquartile Range (IQR) | $13,801 | $16,086 |
| Standard Deviation (Sample) | $12,955 | $9,323 |
| Standard Deviation (Population) | $12,837 | $9,202 |
Similar Demographics by Median Male Earnings
Demographics Similar to Nigerians by Median Male Earnings
In terms of median male earnings, the demographic groups most similar to Nigerians are Immigrants from Venezuela ($52,041, a difference of 0.0%), Immigrants from Cameroon ($52,119, a difference of 0.15%), Immigrants from Panama ($51,962, a difference of 0.15%), Nonimmigrants ($52,170, a difference of 0.25%), and Immigrants from Ghana ($51,836, a difference of 0.39%).
| Demographics | Rating | Rank | Median Male Earnings |
| Delaware | 11.5 /100 | #210 | Poor $52,412 |
| Tlingit-Haida | 11.5 /100 | #211 | Poor $52,409 |
| Cajuns | 10.7 /100 | #212 | Poor $52,325 |
| Native Hawaiians | 10.5 /100 | #213 | Poor $52,306 |
| Immigrants | Nonimmigrants | 9.3 /100 | #214 | Tragic $52,170 |
| Immigrants | Cameroon | 8.9 /100 | #215 | Tragic $52,119 |
| Immigrants | Venezuela | 8.3 /100 | #216 | Tragic $52,041 |
| Nigerians | 8.3 /100 | #217 | Tragic $52,039 |
| Immigrants | Panama | 7.7 /100 | #218 | Tragic $51,962 |
| Immigrants | Ghana | 6.9 /100 | #219 | Tragic $51,836 |
| Immigrants | Armenia | 6.6 /100 | #220 | Tragic $51,793 |
| Immigrants | Senegal | 5.8 /100 | #221 | Tragic $51,647 |
| Immigrants | Bangladesh | 5.8 /100 | #222 | Tragic $51,642 |
| Ecuadorians | 5.5 /100 | #223 | Tragic $51,596 |
| Immigrants | Cambodia | 5.5 /100 | #224 | Tragic $51,594 |
Demographics Similar to Nepalese by Median Male Earnings
In terms of median male earnings, the demographic groups most similar to Nepalese are Cree ($49,497, a difference of 0.080%), Iroquois ($49,374, a difference of 0.17%), Liberian ($49,318, a difference of 0.28%), British West Indian ($49,636, a difference of 0.36%), and Immigrants from West Indies ($49,271, a difference of 0.38%).
| Demographics | Rating | Rank | Median Male Earnings |
| Immigrants | Cabo Verde | 1.2 /100 | #252 | Tragic $50,009 |
| German Russians | 1.1 /100 | #253 | Tragic $49,924 |
| Senegalese | 1.0 /100 | #254 | Tragic $49,774 |
| Alaskan Athabascans | 0.9 /100 | #255 | Tragic $49,748 |
| Alaska Natives | 0.9 /100 | #256 | Tragic $49,711 |
| British West Indians | 0.8 /100 | #257 | Tragic $49,636 |
| Cree | 0.7 /100 | #258 | Tragic $49,497 |
| Nepalese | 0.7 /100 | #259 | Tragic $49,458 |
| Iroquois | 0.7 /100 | #260 | Tragic $49,374 |
| Liberians | 0.6 /100 | #261 | Tragic $49,318 |
| Immigrants | West Indies | 0.6 /100 | #262 | Tragic $49,271 |
| Nicaraguans | 0.6 /100 | #263 | Tragic $49,215 |
| Immigrants | Middle Africa | 0.6 /100 | #264 | Tragic $49,201 |
| Immigrants | Laos | 0.6 /100 | #265 | Tragic $49,190 |
| Somalis | 0.5 /100 | #266 | Tragic $49,025 |