Slovak vs German Russian Median Family Income
COMPARE
Slovak
German Russian
Median Family Income
Median Family Income Comparison
Slovaks
German Russians
$103,729
MEDIAN FAMILY INCOME
63.1/ 100
METRIC RATING
165th/ 347
METRIC RANK
$93,858
MEDIAN FAMILY INCOME
1.1/ 100
METRIC RATING
243rd/ 347
METRIC RANK
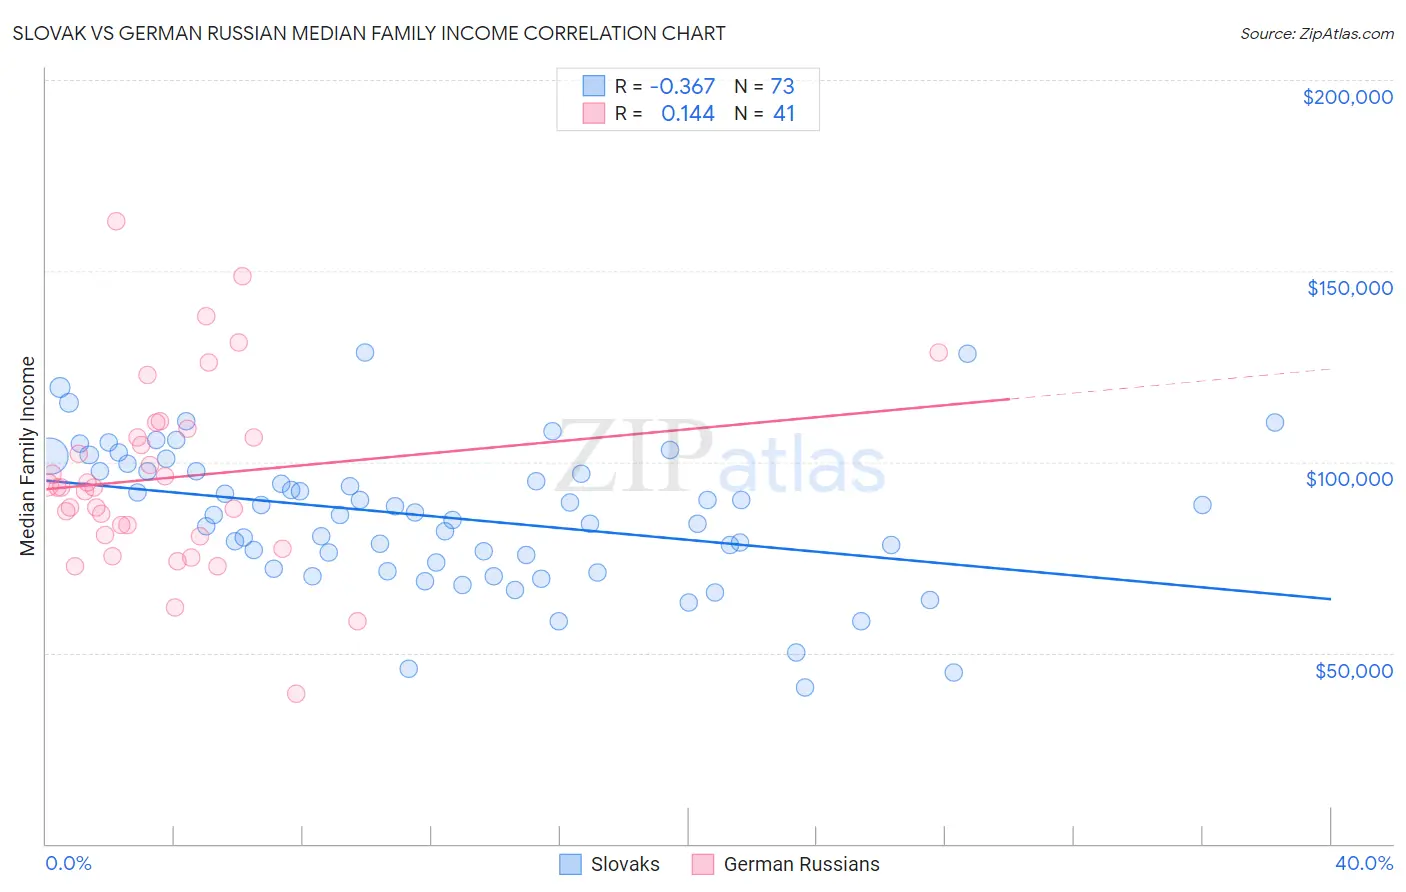
Slovak vs German Russian Median Family Income Correlation Chart
The statistical analysis conducted on geographies consisting of 397,537,551 people shows a mild negative correlation between the proportion of Slovaks and median family income in the United States with a correlation coefficient (R) of -0.367 and weighted average of $103,729. Similarly, the statistical analysis conducted on geographies consisting of 96,441,626 people shows a poor positive correlation between the proportion of German Russians and median family income in the United States with a correlation coefficient (R) of 0.144 and weighted average of $93,858, a difference of 10.5%.
Median Family Income Correlation Summary
| Measurement | Slovak | German Russian |
| Minimum | $40,809 | $39,167 |
| Maximum | $128,732 | $163,128 |
| Range | $87,923 | $123,961 |
| Mean | $85,532 | $95,905 |
| Median | $86,184 | $93,261 |
| Interquartile 25% (IQ1) | $72,785 | $80,798 |
| Interquartile 75% (IQ3) | $97,619 | $107,632 |
| Interquartile Range (IQR) | $24,833 | $26,834 |
| Standard Deviation (Sample) | $18,291 | $24,350 |
| Standard Deviation (Population) | $18,165 | $24,051 |
Similar Demographics by Median Family Income
Demographics Similar to Slovaks by Median Family Income
In terms of median family income, the demographic groups most similar to Slovaks are English ($103,684, a difference of 0.040%), South American Indian ($103,624, a difference of 0.10%), Sierra Leonean ($103,859, a difference of 0.13%), Immigrants from Peru ($103,534, a difference of 0.19%), and Immigrants from Sierra Leone ($103,990, a difference of 0.25%).
| Demographics | Rating | Rank | Median Family Income |
| Scandinavians | 70.8 /100 | #158 | Good $104,410 |
| Swiss | 70.7 /100 | #159 | Good $104,396 |
| Scottish | 69.5 /100 | #160 | Good $104,288 |
| Icelanders | 69.4 /100 | #161 | Good $104,282 |
| Immigrants | Sierra Leone | 66.2 /100 | #162 | Good $103,990 |
| Costa Ricans | 66.2 /100 | #163 | Good $103,989 |
| Sierra Leoneans | 64.7 /100 | #164 | Good $103,859 |
| Slovaks | 63.1 /100 | #165 | Good $103,729 |
| English | 62.6 /100 | #166 | Good $103,684 |
| South American Indians | 61.9 /100 | #167 | Good $103,624 |
| Immigrants | Peru | 60.8 /100 | #168 | Good $103,534 |
| Czechoslovakians | 57.6 /100 | #169 | Average $103,273 |
| Immigrants | Uzbekistan | 56.6 /100 | #170 | Average $103,197 |
| Alsatians | 54.3 /100 | #171 | Average $103,010 |
| Immigrants | Eritrea | 51.9 /100 | #172 | Average $102,823 |
Demographics Similar to German Russians by Median Family Income
In terms of median family income, the demographic groups most similar to German Russians are Barbadian ($93,919, a difference of 0.060%), Subsaharan African ($93,748, a difference of 0.12%), Immigrants from Trinidad and Tobago ($93,988, a difference of 0.14%), Somali ($94,085, a difference of 0.24%), and Salvadoran ($94,109, a difference of 0.27%).
| Demographics | Rating | Rank | Median Family Income |
| Trinidadians and Tobagonians | 1.5 /100 | #236 | Tragic $94,466 |
| Alaskan Athabascans | 1.5 /100 | #237 | Tragic $94,429 |
| Nepalese | 1.3 /100 | #238 | Tragic $94,153 |
| Salvadorans | 1.2 /100 | #239 | Tragic $94,109 |
| Somalis | 1.2 /100 | #240 | Tragic $94,085 |
| Immigrants | Trinidad and Tobago | 1.2 /100 | #241 | Tragic $93,988 |
| Barbadians | 1.1 /100 | #242 | Tragic $93,919 |
| German Russians | 1.1 /100 | #243 | Tragic $93,858 |
| Sub-Saharan Africans | 1.0 /100 | #244 | Tragic $93,748 |
| Immigrants | Middle Africa | 1.0 /100 | #245 | Tragic $93,593 |
| Guyanese | 0.9 /100 | #246 | Tragic $93,373 |
| Immigrants | Senegal | 0.7 /100 | #247 | Tragic $92,912 |
| French American Indians | 0.7 /100 | #248 | Tragic $92,872 |
| Immigrants | Ecuador | 0.7 /100 | #249 | Tragic $92,837 |
| West Indians | 0.6 /100 | #250 | Tragic $92,765 |