Slovak vs Immigrants from Poland Median Family Income
COMPARE
Slovak
Immigrants from Poland
Median Family Income
Median Family Income Comparison
Slovaks
Immigrants from Poland
$103,729
MEDIAN FAMILY INCOME
63.1/ 100
METRIC RATING
165th/ 347
METRIC RANK
$108,570
MEDIAN FAMILY INCOME
95.3/ 100
METRIC RATING
112th/ 347
METRIC RANK
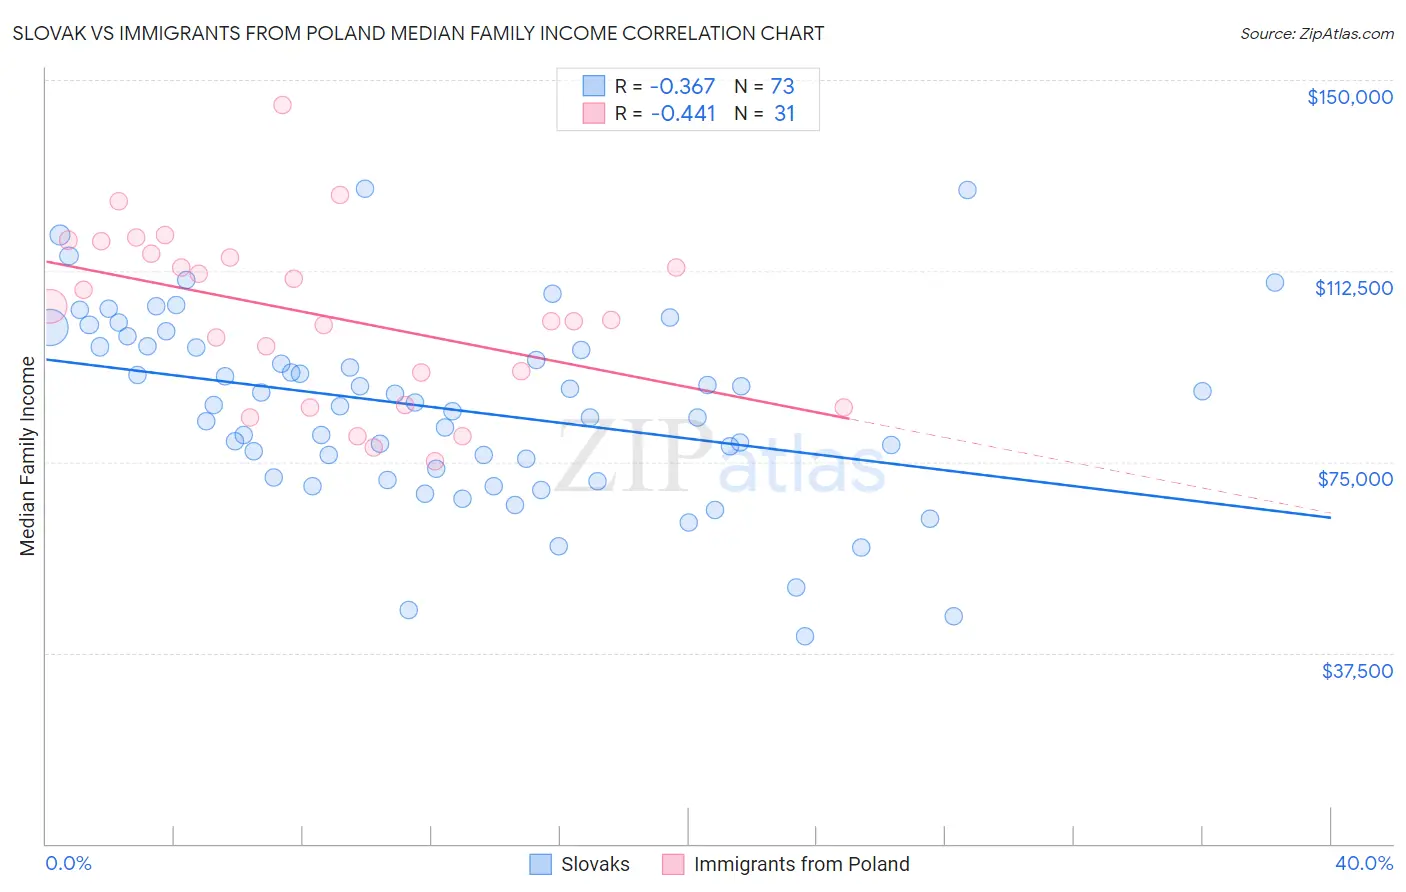
Slovak vs Immigrants from Poland Median Family Income Correlation Chart
The statistical analysis conducted on geographies consisting of 397,537,551 people shows a mild negative correlation between the proportion of Slovaks and median family income in the United States with a correlation coefficient (R) of -0.367 and weighted average of $103,729. Similarly, the statistical analysis conducted on geographies consisting of 304,741,932 people shows a moderate negative correlation between the proportion of Immigrants from Poland and median family income in the United States with a correlation coefficient (R) of -0.441 and weighted average of $108,570, a difference of 4.7%.
Median Family Income Correlation Summary
| Measurement | Slovak | Immigrants from Poland |
| Minimum | $40,809 | $75,129 |
| Maximum | $128,732 | $144,968 |
| Range | $87,923 | $69,839 |
| Mean | $85,532 | $103,726 |
| Median | $86,184 | $102,831 |
| Interquartile 25% (IQ1) | $72,785 | $86,137 |
| Interquartile 75% (IQ3) | $97,619 | $115,861 |
| Interquartile Range (IQR) | $24,833 | $29,724 |
| Standard Deviation (Sample) | $18,291 | $16,903 |
| Standard Deviation (Population) | $18,165 | $16,628 |
Similar Demographics by Median Family Income
Demographics Similar to Slovaks by Median Family Income
In terms of median family income, the demographic groups most similar to Slovaks are English ($103,684, a difference of 0.040%), South American Indian ($103,624, a difference of 0.10%), Sierra Leonean ($103,859, a difference of 0.13%), Immigrants from Peru ($103,534, a difference of 0.19%), and Immigrants from Sierra Leone ($103,990, a difference of 0.25%).
| Demographics | Rating | Rank | Median Family Income |
| Scandinavians | 70.8 /100 | #158 | Good $104,410 |
| Swiss | 70.7 /100 | #159 | Good $104,396 |
| Scottish | 69.5 /100 | #160 | Good $104,288 |
| Icelanders | 69.4 /100 | #161 | Good $104,282 |
| Immigrants | Sierra Leone | 66.2 /100 | #162 | Good $103,990 |
| Costa Ricans | 66.2 /100 | #163 | Good $103,989 |
| Sierra Leoneans | 64.7 /100 | #164 | Good $103,859 |
| Slovaks | 63.1 /100 | #165 | Good $103,729 |
| English | 62.6 /100 | #166 | Good $103,684 |
| South American Indians | 61.9 /100 | #167 | Good $103,624 |
| Immigrants | Peru | 60.8 /100 | #168 | Good $103,534 |
| Czechoslovakians | 57.6 /100 | #169 | Average $103,273 |
| Immigrants | Uzbekistan | 56.6 /100 | #170 | Average $103,197 |
| Alsatians | 54.3 /100 | #171 | Average $103,010 |
| Immigrants | Eritrea | 51.9 /100 | #172 | Average $102,823 |
Demographics Similar to Immigrants from Poland by Median Family Income
In terms of median family income, the demographic groups most similar to Immigrants from Poland are Immigrants from Saudi Arabia ($108,544, a difference of 0.020%), Polish ($108,507, a difference of 0.060%), Swedish ($108,499, a difference of 0.070%), Immigrants from Western Asia ($108,691, a difference of 0.11%), and British ($108,705, a difference of 0.12%).
| Demographics | Rating | Rank | Median Family Income |
| Syrians | 96.7 /100 | #105 | Exceptional $109,299 |
| Albanians | 96.4 /100 | #106 | Exceptional $109,136 |
| Immigrants | North Macedonia | 96.4 /100 | #107 | Exceptional $109,136 |
| Immigrants | Zimbabwe | 95.9 /100 | #108 | Exceptional $108,830 |
| Immigrants | Afghanistan | 95.6 /100 | #109 | Exceptional $108,709 |
| British | 95.6 /100 | #110 | Exceptional $108,705 |
| Immigrants | Western Asia | 95.6 /100 | #111 | Exceptional $108,691 |
| Immigrants | Poland | 95.3 /100 | #112 | Exceptional $108,570 |
| Immigrants | Saudi Arabia | 95.2 /100 | #113 | Exceptional $108,544 |
| Poles | 95.2 /100 | #114 | Exceptional $108,507 |
| Swedes | 95.1 /100 | #115 | Exceptional $108,499 |
| Chileans | 95.0 /100 | #116 | Exceptional $108,429 |
| Immigrants | Philippines | 94.6 /100 | #117 | Exceptional $108,288 |
| Ethiopians | 94.5 /100 | #118 | Exceptional $108,251 |
| Sri Lankans | 94.5 /100 | #119 | Exceptional $108,234 |