Slovak vs German Russian Unemployment Among Seniors over 75 years
COMPARE
Slovak
German Russian
Unemployment Among Seniors over 75 years
Unemployment Among Seniors over 75 years Comparison
Slovaks
German Russians
10.4%
UNEMPLOYMENT AMONG SENIORS OVER 75 YEARS
0.0/ 100
METRIC RATING
326th/ 347
METRIC RANK
8.4%
UNEMPLOYMENT AMONG SENIORS OVER 75 YEARS
94.9/ 100
METRIC RATING
131st/ 347
METRIC RANK
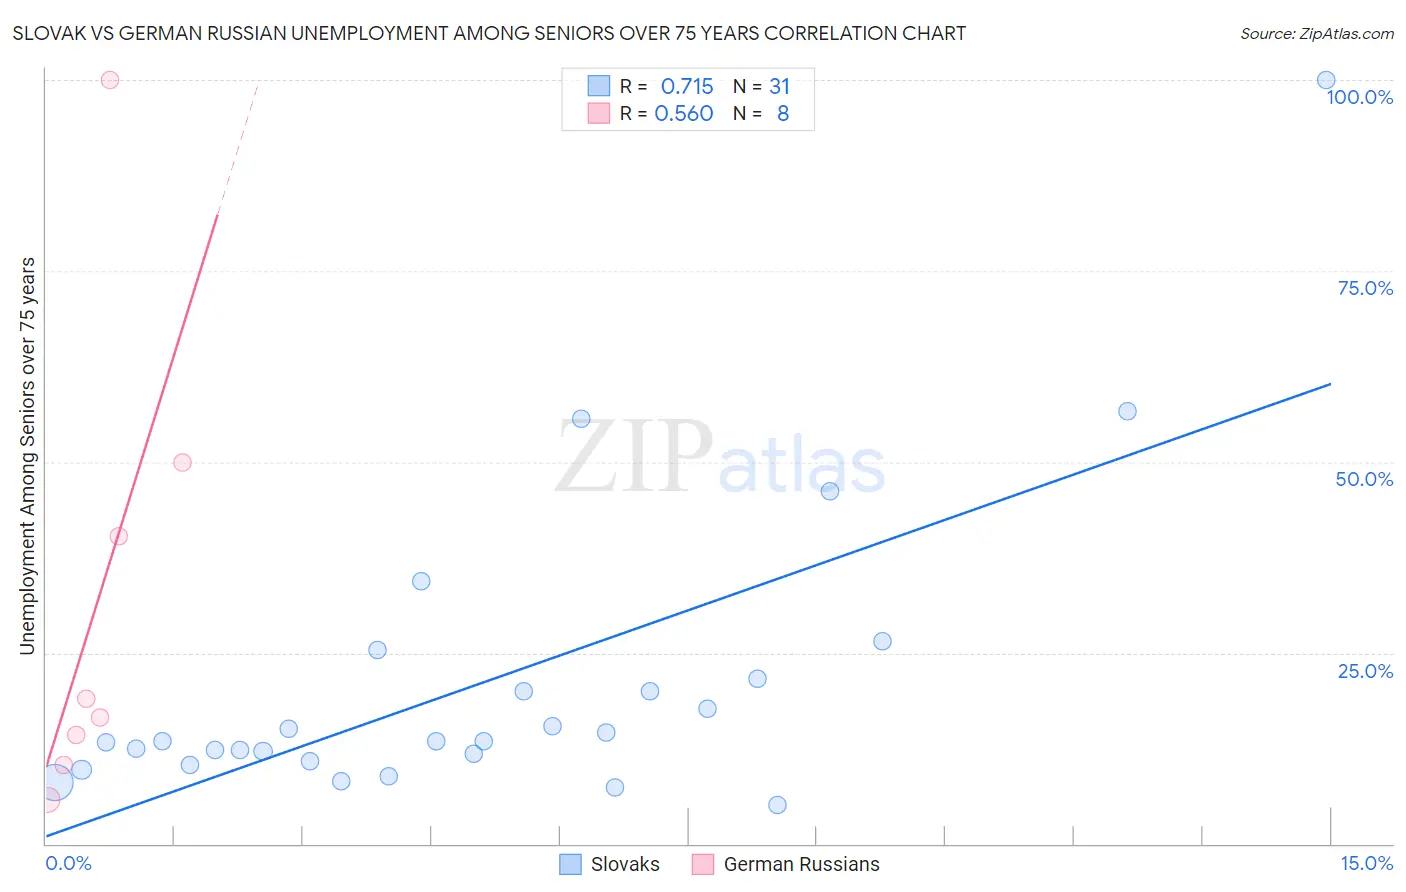
Slovak vs German Russian Unemployment Among Seniors over 75 years Correlation Chart
The statistical analysis conducted on geographies consisting of 198,086,533 people shows a strong positive correlation between the proportion of Slovaks and unemployment rate among seniors over the age of 75 in the United States with a correlation coefficient (R) of 0.715 and weighted average of 10.4%. Similarly, the statistical analysis conducted on geographies consisting of 73,268,309 people shows a substantial positive correlation between the proportion of German Russians and unemployment rate among seniors over the age of 75 in the United States with a correlation coefficient (R) of 0.560 and weighted average of 8.4%, a difference of 24.1%.
Unemployment Among Seniors over 75 years Correlation Summary
| Measurement | Slovak | German Russian |
| Minimum | 5.0% | 5.8% |
| Maximum | 100.0% | 100.0% |
| Range | 95.0% | 94.2% |
| Mean | 21.0% | 32.0% |
| Median | 13.4% | 17.8% |
| Interquartile 25% (IQ1) | 10.8% | 12.3% |
| Interquartile 75% (IQ3) | 21.6% | 45.1% |
| Interquartile Range (IQR) | 10.8% | 32.8% |
| Standard Deviation (Sample) | 19.6% | 31.4% |
| Standard Deviation (Population) | 19.3% | 29.4% |
Similar Demographics by Unemployment Among Seniors over 75 years
Demographics Similar to Slovaks by Unemployment Among Seniors over 75 years
In terms of unemployment among seniors over 75 years, the demographic groups most similar to Slovaks are Dutch (10.4%, a difference of 0.080%), Portuguese (10.4%, a difference of 0.23%), American (10.4%, a difference of 0.43%), Tongan (10.4%, a difference of 0.46%), and Immigrants from Portugal (10.5%, a difference of 0.71%).
| Demographics | Rating | Rank | Unemployment Among Seniors over 75 years |
| Germans | 0.0 /100 | #319 | Tragic 10.3% |
| French | 0.0 /100 | #320 | Tragic 10.3% |
| Aleuts | 0.0 /100 | #321 | Tragic 10.3% |
| Poles | 0.0 /100 | #322 | Tragic 10.3% |
| Tongans | 0.0 /100 | #323 | Tragic 10.4% |
| Americans | 0.0 /100 | #324 | Tragic 10.4% |
| Portuguese | 0.0 /100 | #325 | Tragic 10.4% |
| Slovaks | 0.0 /100 | #326 | Tragic 10.4% |
| Dutch | 0.0 /100 | #327 | Tragic 10.4% |
| Immigrants | Portugal | 0.0 /100 | #328 | Tragic 10.5% |
| Tsimshian | 0.0 /100 | #329 | Tragic 10.5% |
| Immigrants | Azores | 0.0 /100 | #330 | Tragic 10.7% |
| Tohono O'odham | 0.0 /100 | #331 | Tragic 10.8% |
| Immigrants | Liberia | 0.0 /100 | #332 | Tragic 10.9% |
| Alaskan Athabascans | 0.0 /100 | #333 | Tragic 11.0% |
Demographics Similar to German Russians by Unemployment Among Seniors over 75 years
In terms of unemployment among seniors over 75 years, the demographic groups most similar to German Russians are Apache (8.4%, a difference of 0.080%), Chilean (8.4%, a difference of 0.28%), Serbian (8.4%, a difference of 0.31%), Ghanaian (8.4%, a difference of 0.36%), and Native Hawaiian (8.4%, a difference of 0.39%).
| Demographics | Rating | Rank | Unemployment Among Seniors over 75 years |
| Thais | 96.8 /100 | #124 | Exceptional 8.3% |
| Immigrants | Moldova | 96.7 /100 | #125 | Exceptional 8.3% |
| Belizeans | 96.3 /100 | #126 | Exceptional 8.4% |
| Hondurans | 96.2 /100 | #127 | Exceptional 8.4% |
| Native Hawaiians | 96.1 /100 | #128 | Exceptional 8.4% |
| Ghanaians | 96.0 /100 | #129 | Exceptional 8.4% |
| Apache | 95.2 /100 | #130 | Exceptional 8.4% |
| German Russians | 94.9 /100 | #131 | Exceptional 8.4% |
| Chileans | 93.8 /100 | #132 | Exceptional 8.4% |
| Serbians | 93.7 /100 | #133 | Exceptional 8.4% |
| Immigrants | Czechoslovakia | 93.4 /100 | #134 | Exceptional 8.4% |
| Haitians | 91.4 /100 | #135 | Exceptional 8.5% |
| Immigrants | Trinidad and Tobago | 90.8 /100 | #136 | Exceptional 8.5% |
| Immigrants | Kuwait | 90.5 /100 | #137 | Exceptional 8.5% |
| Immigrants | Bulgaria | 89.6 /100 | #138 | Excellent 8.5% |