Immigrants from Chile vs German Russian Median Family Income
COMPARE
Immigrants from Chile
German Russian
Median Family Income
Median Family Income Comparison
Immigrants from Chile
German Russians
$105,655
MEDIAN FAMILY INCOME
82.1/ 100
METRIC RATING
147th/ 347
METRIC RANK
$93,858
MEDIAN FAMILY INCOME
1.1/ 100
METRIC RATING
243rd/ 347
METRIC RANK
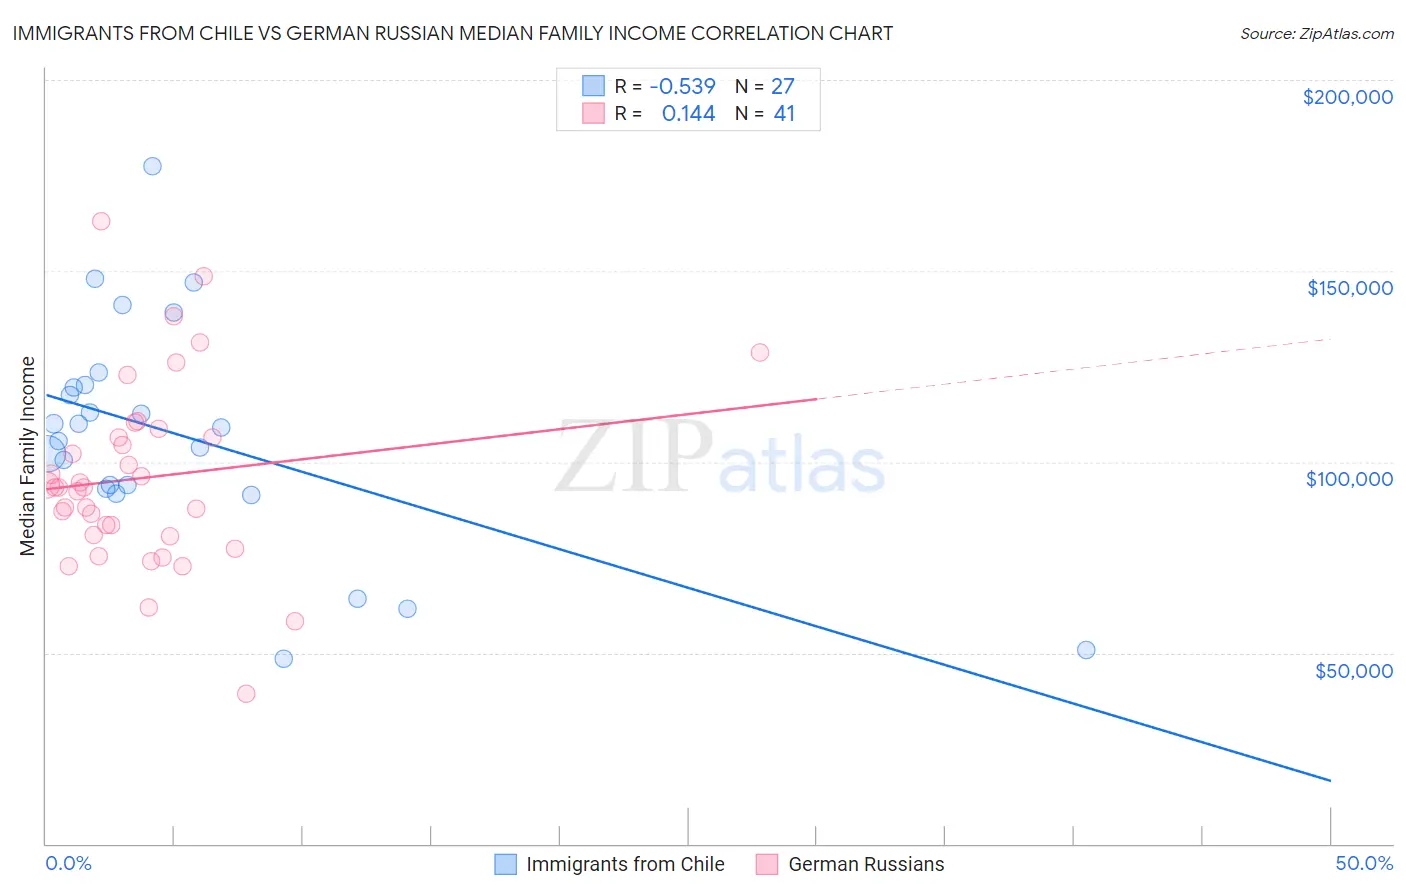
Immigrants from Chile vs German Russian Median Family Income Correlation Chart
The statistical analysis conducted on geographies consisting of 218,577,241 people shows a substantial negative correlation between the proportion of Immigrants from Chile and median family income in the United States with a correlation coefficient (R) of -0.539 and weighted average of $105,655. Similarly, the statistical analysis conducted on geographies consisting of 96,441,626 people shows a poor positive correlation between the proportion of German Russians and median family income in the United States with a correlation coefficient (R) of 0.144 and weighted average of $93,858, a difference of 12.6%.
Median Family Income Correlation Summary
| Measurement | Immigrants from Chile | German Russian |
| Minimum | $48,403 | $39,167 |
| Maximum | $177,440 | $163,128 |
| Range | $129,037 | $123,961 |
| Mean | $106,979 | $95,905 |
| Median | $109,000 | $93,261 |
| Interquartile 25% (IQ1) | $92,919 | $80,798 |
| Interquartile 75% (IQ3) | $120,092 | $107,632 |
| Interquartile Range (IQR) | $27,173 | $26,834 |
| Standard Deviation (Sample) | $29,634 | $24,350 |
| Standard Deviation (Population) | $29,080 | $24,051 |
Similar Demographics by Median Family Income
Demographics Similar to Immigrants from Chile by Median Family Income
In terms of median family income, the demographic groups most similar to Immigrants from Chile are Hungarian ($105,609, a difference of 0.040%), Immigrants from Germany ($105,507, a difference of 0.14%), Czech ($105,839, a difference of 0.17%), Irish ($105,453, a difference of 0.19%), and Peruvian ($105,444, a difference of 0.20%).
| Demographics | Rating | Rank | Median Family Income |
| Norwegians | 85.5 /100 | #140 | Excellent $106,144 |
| Immigrants | Syria | 85.3 /100 | #141 | Excellent $106,118 |
| Slovenes | 84.7 /100 | #142 | Excellent $106,020 |
| Tongans | 84.3 /100 | #143 | Excellent $105,967 |
| Immigrants | Morocco | 84.3 /100 | #144 | Excellent $105,964 |
| Danes | 83.8 /100 | #145 | Excellent $105,900 |
| Czechs | 83.4 /100 | #146 | Excellent $105,839 |
| Immigrants | Chile | 82.1 /100 | #147 | Excellent $105,655 |
| Hungarians | 81.7 /100 | #148 | Excellent $105,609 |
| Immigrants | Germany | 80.9 /100 | #149 | Excellent $105,507 |
| Irish | 80.5 /100 | #150 | Excellent $105,453 |
| Peruvians | 80.4 /100 | #151 | Excellent $105,444 |
| Immigrants | Albania | 79.1 /100 | #152 | Good $105,285 |
| Slavs | 77.9 /100 | #153 | Good $105,144 |
| Immigrants | Nepal | 76.3 /100 | #154 | Good $104,966 |
Demographics Similar to German Russians by Median Family Income
In terms of median family income, the demographic groups most similar to German Russians are Barbadian ($93,919, a difference of 0.060%), Subsaharan African ($93,748, a difference of 0.12%), Immigrants from Trinidad and Tobago ($93,988, a difference of 0.14%), Somali ($94,085, a difference of 0.24%), and Salvadoran ($94,109, a difference of 0.27%).
| Demographics | Rating | Rank | Median Family Income |
| Trinidadians and Tobagonians | 1.5 /100 | #236 | Tragic $94,466 |
| Alaskan Athabascans | 1.5 /100 | #237 | Tragic $94,429 |
| Nepalese | 1.3 /100 | #238 | Tragic $94,153 |
| Salvadorans | 1.2 /100 | #239 | Tragic $94,109 |
| Somalis | 1.2 /100 | #240 | Tragic $94,085 |
| Immigrants | Trinidad and Tobago | 1.2 /100 | #241 | Tragic $93,988 |
| Barbadians | 1.1 /100 | #242 | Tragic $93,919 |
| German Russians | 1.1 /100 | #243 | Tragic $93,858 |
| Sub-Saharan Africans | 1.0 /100 | #244 | Tragic $93,748 |
| Immigrants | Middle Africa | 1.0 /100 | #245 | Tragic $93,593 |
| Guyanese | 0.9 /100 | #246 | Tragic $93,373 |
| Immigrants | Senegal | 0.7 /100 | #247 | Tragic $92,912 |
| French American Indians | 0.7 /100 | #248 | Tragic $92,872 |
| Immigrants | Ecuador | 0.7 /100 | #249 | Tragic $92,837 |
| West Indians | 0.6 /100 | #250 | Tragic $92,765 |