Immigrants from Korea vs German Russian Median Family Income
COMPARE
Immigrants from Korea
German Russian
Median Family Income
Median Family Income Comparison
Immigrants from Korea
German Russians
$122,800
MEDIAN FAMILY INCOME
100.0/ 100
METRIC RATING
21st/ 347
METRIC RANK
$93,858
MEDIAN FAMILY INCOME
1.1/ 100
METRIC RATING
243rd/ 347
METRIC RANK
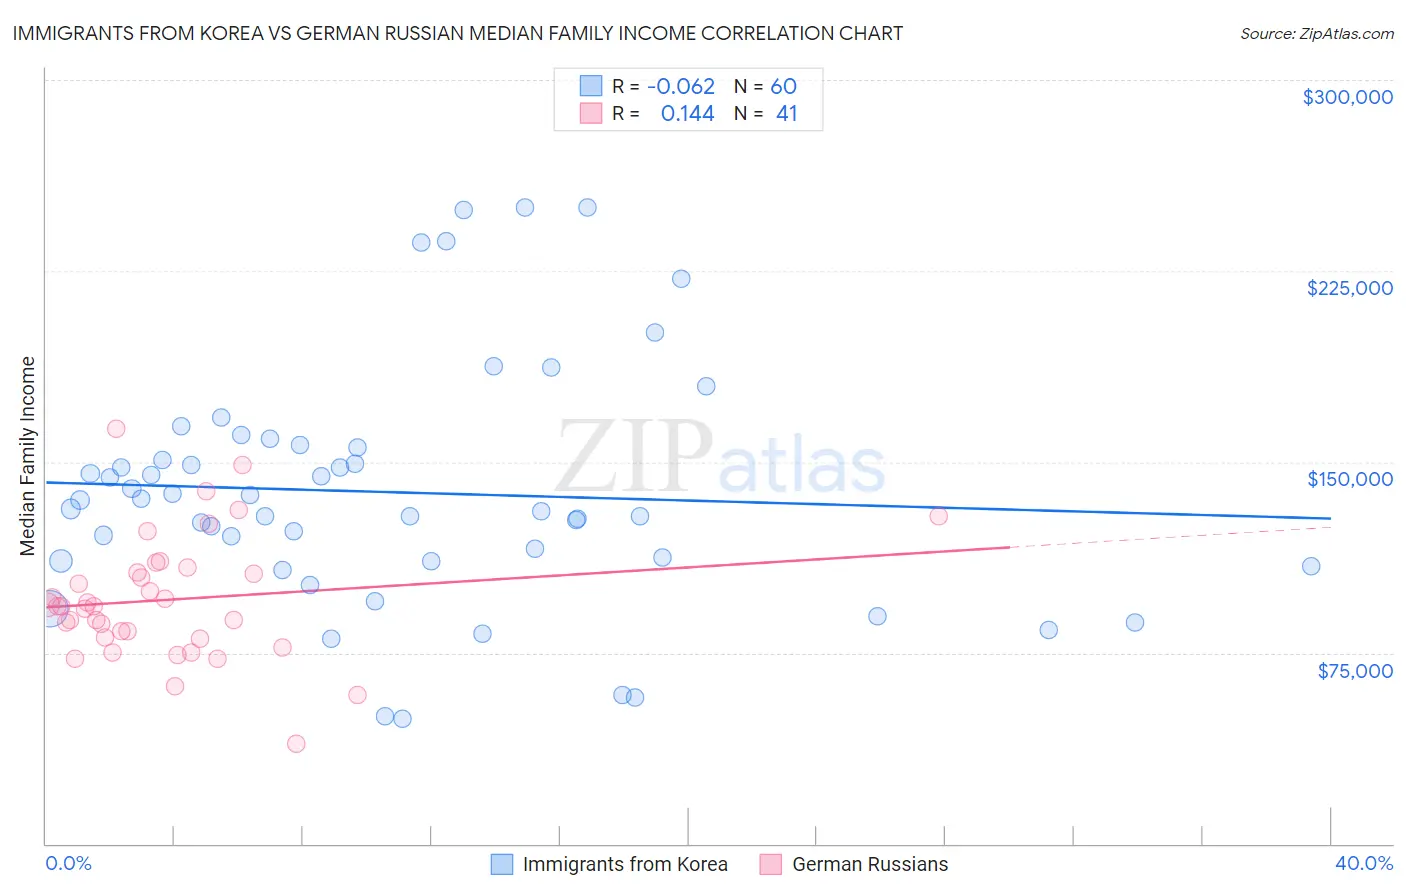
Immigrants from Korea vs German Russian Median Family Income Correlation Chart
The statistical analysis conducted on geographies consisting of 415,814,318 people shows a slight negative correlation between the proportion of Immigrants from Korea and median family income in the United States with a correlation coefficient (R) of -0.062 and weighted average of $122,800. Similarly, the statistical analysis conducted on geographies consisting of 96,441,626 people shows a poor positive correlation between the proportion of German Russians and median family income in the United States with a correlation coefficient (R) of 0.144 and weighted average of $93,858, a difference of 30.8%.
Median Family Income Correlation Summary
| Measurement | Immigrants from Korea | German Russian |
| Minimum | $49,182 | $39,167 |
| Maximum | $250,001 | $163,128 |
| Range | $200,819 | $123,961 |
| Mean | $138,061 | $95,905 |
| Median | $133,220 | $93,261 |
| Interquartile 25% (IQ1) | $110,996 | $80,798 |
| Interquartile 75% (IQ3) | $156,101 | $107,632 |
| Interquartile Range (IQR) | $45,105 | $26,834 |
| Standard Deviation (Sample) | $47,393 | $24,350 |
| Standard Deviation (Population) | $46,996 | $24,051 |
Similar Demographics by Median Family Income
Demographics Similar to Immigrants from Korea by Median Family Income
In terms of median family income, the demographic groups most similar to Immigrants from Korea are Immigrants from Sweden ($122,765, a difference of 0.030%), Immigrants from Japan ($122,764, a difference of 0.030%), Burmese ($123,369, a difference of 0.46%), Immigrants from Northern Europe ($121,840, a difference of 0.79%), and Immigrants from Belgium ($123,831, a difference of 0.84%).
| Demographics | Rating | Rank | Median Family Income |
| Immigrants | South Central Asia | 100.0 /100 | #14 | Exceptional $125,956 |
| Eastern Europeans | 100.0 /100 | #15 | Exceptional $125,546 |
| Immigrants | China | 100.0 /100 | #16 | Exceptional $125,540 |
| Indians (Asian) | 100.0 /100 | #17 | Exceptional $125,312 |
| Immigrants | Eastern Asia | 100.0 /100 | #18 | Exceptional $125,150 |
| Immigrants | Belgium | 100.0 /100 | #19 | Exceptional $123,831 |
| Burmese | 100.0 /100 | #20 | Exceptional $123,369 |
| Immigrants | Korea | 100.0 /100 | #21 | Exceptional $122,800 |
| Immigrants | Sweden | 100.0 /100 | #22 | Exceptional $122,765 |
| Immigrants | Japan | 100.0 /100 | #23 | Exceptional $122,764 |
| Immigrants | Northern Europe | 100.0 /100 | #24 | Exceptional $121,840 |
| Turks | 100.0 /100 | #25 | Exceptional $121,202 |
| Immigrants | Switzerland | 100.0 /100 | #26 | Exceptional $120,726 |
| Russians | 100.0 /100 | #27 | Exceptional $120,487 |
| Immigrants | Denmark | 100.0 /100 | #28 | Exceptional $120,445 |
Demographics Similar to German Russians by Median Family Income
In terms of median family income, the demographic groups most similar to German Russians are Barbadian ($93,919, a difference of 0.060%), Subsaharan African ($93,748, a difference of 0.12%), Immigrants from Trinidad and Tobago ($93,988, a difference of 0.14%), Somali ($94,085, a difference of 0.24%), and Salvadoran ($94,109, a difference of 0.27%).
| Demographics | Rating | Rank | Median Family Income |
| Trinidadians and Tobagonians | 1.5 /100 | #236 | Tragic $94,466 |
| Alaskan Athabascans | 1.5 /100 | #237 | Tragic $94,429 |
| Nepalese | 1.3 /100 | #238 | Tragic $94,153 |
| Salvadorans | 1.2 /100 | #239 | Tragic $94,109 |
| Somalis | 1.2 /100 | #240 | Tragic $94,085 |
| Immigrants | Trinidad and Tobago | 1.2 /100 | #241 | Tragic $93,988 |
| Barbadians | 1.1 /100 | #242 | Tragic $93,919 |
| German Russians | 1.1 /100 | #243 | Tragic $93,858 |
| Sub-Saharan Africans | 1.0 /100 | #244 | Tragic $93,748 |
| Immigrants | Middle Africa | 1.0 /100 | #245 | Tragic $93,593 |
| Guyanese | 0.9 /100 | #246 | Tragic $93,373 |
| Immigrants | Senegal | 0.7 /100 | #247 | Tragic $92,912 |
| French American Indians | 0.7 /100 | #248 | Tragic $92,872 |
| Immigrants | Ecuador | 0.7 /100 | #249 | Tragic $92,837 |
| West Indians | 0.6 /100 | #250 | Tragic $92,765 |