English vs Lebanese Householder Income Over 65 years
COMPARE
English
Lebanese
Householder Income Over 65 years
Householder Income Over 65 years Comparison
English
Lebanese
$61,487
HOUSEHOLDER INCOME OVER 65 YEARS
63.3/ 100
METRIC RATING
158th/ 347
METRIC RANK
$62,287
HOUSEHOLDER INCOME OVER 65 YEARS
79.9/ 100
METRIC RATING
139th/ 347
METRIC RANK
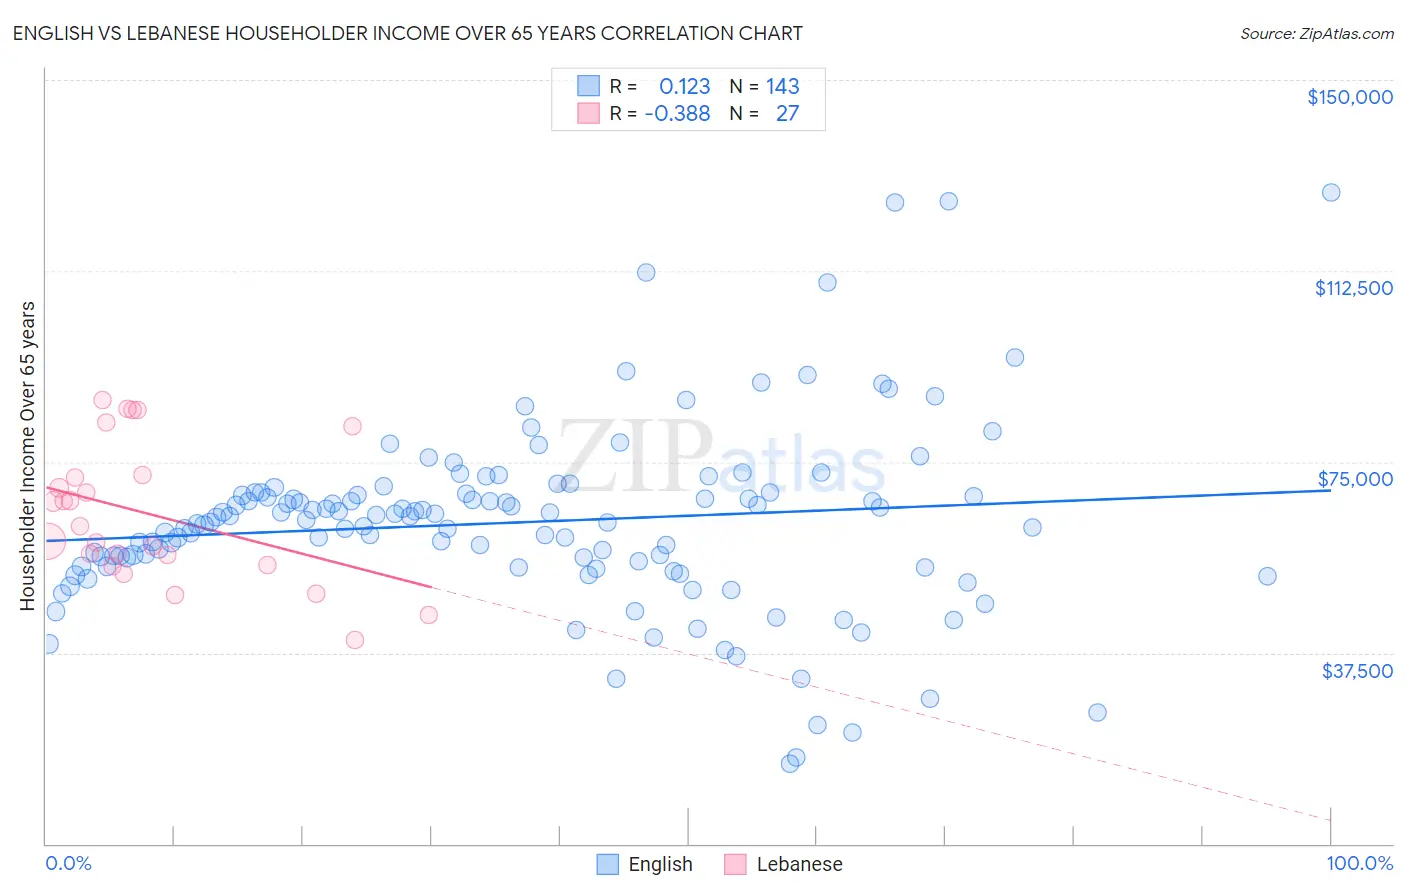
English vs Lebanese Householder Income Over 65 years Correlation Chart
The statistical analysis conducted on geographies consisting of 573,164,931 people shows a poor positive correlation between the proportion of English and household income with householder over the age of 65 in the United States with a correlation coefficient (R) of 0.123 and weighted average of $61,487. Similarly, the statistical analysis conducted on geographies consisting of 400,240,263 people shows a mild negative correlation between the proportion of Lebanese and household income with householder over the age of 65 in the United States with a correlation coefficient (R) of -0.388 and weighted average of $62,287, a difference of 1.3%.
Householder Income Over 65 years Correlation Summary
| Measurement | English | Lebanese |
| Minimum | $15,670 | $39,905 |
| Maximum | $127,891 | $87,260 |
| Range | $112,221 | $47,355 |
| Mean | $63,109 | $64,724 |
| Median | $63,519 | $62,393 |
| Interquartile 25% (IQ1) | $54,458 | $54,830 |
| Interquartile 75% (IQ3) | $68,838 | $72,386 |
| Interquartile Range (IQR) | $14,380 | $17,556 |
| Standard Deviation (Sample) | $18,180 | $13,483 |
| Standard Deviation (Population) | $18,116 | $13,231 |
Demographics Similar to English and Lebanese by Householder Income Over 65 years
In terms of householder income over 65 years, the demographic groups most similar to English are Macedonian ($61,564, a difference of 0.13%), Scandinavian ($61,586, a difference of 0.16%), Polish ($61,598, a difference of 0.18%), Swiss ($61,621, a difference of 0.22%), and Costa Rican ($61,638, a difference of 0.25%). Similarly, the demographic groups most similar to Lebanese are Immigrants from Kazakhstan ($62,292, a difference of 0.010%), Arab ($62,266, a difference of 0.030%), Canadian ($62,230, a difference of 0.090%), South American Indian ($62,215, a difference of 0.12%), and Immigrants from Belarus ($62,162, a difference of 0.20%).
| Demographics | Rating | Rank | Householder Income Over 65 years |
| Immigrants | Kazakhstan | 80.0 /100 | #138 | Excellent $62,292 |
| Lebanese | 79.9 /100 | #139 | Good $62,287 |
| Arabs | 79.6 /100 | #140 | Good $62,266 |
| Canadians | 79.0 /100 | #141 | Good $62,230 |
| South American Indians | 78.7 /100 | #142 | Good $62,215 |
| Immigrants | Belarus | 77.8 /100 | #143 | Good $62,162 |
| Immigrants | Peru | 74.4 /100 | #144 | Good $61,988 |
| Immigrants | Uganda | 74.2 /100 | #145 | Good $61,976 |
| Immigrants | Southern Europe | 72.7 /100 | #146 | Good $61,902 |
| Immigrants | Nepal | 71.4 /100 | #147 | Good $61,843 |
| Alsatians | 70.5 /100 | #148 | Good $61,797 |
| Scottish | 69.1 /100 | #149 | Good $61,735 |
| Slavs | 68.5 /100 | #150 | Good $61,709 |
| Hungarians | 67.7 /100 | #151 | Good $61,673 |
| Armenians | 67.3 /100 | #152 | Good $61,656 |
| Costa Ricans | 66.9 /100 | #153 | Good $61,638 |
| Swiss | 66.5 /100 | #154 | Good $61,621 |
| Poles | 65.9 /100 | #155 | Good $61,598 |
| Scandinavians | 65.6 /100 | #156 | Good $61,586 |
| Macedonians | 65.1 /100 | #157 | Good $61,564 |
| English | 63.3 /100 | #158 | Good $61,487 |