Moroccan vs Lebanese Householder Income Over 65 years
COMPARE
Moroccan
Lebanese
Householder Income Over 65 years
Householder Income Over 65 years Comparison
Moroccans
Lebanese
$59,683
HOUSEHOLDER INCOME OVER 65 YEARS
20.7/ 100
METRIC RATING
198th/ 347
METRIC RANK
$62,287
HOUSEHOLDER INCOME OVER 65 YEARS
79.9/ 100
METRIC RATING
139th/ 347
METRIC RANK
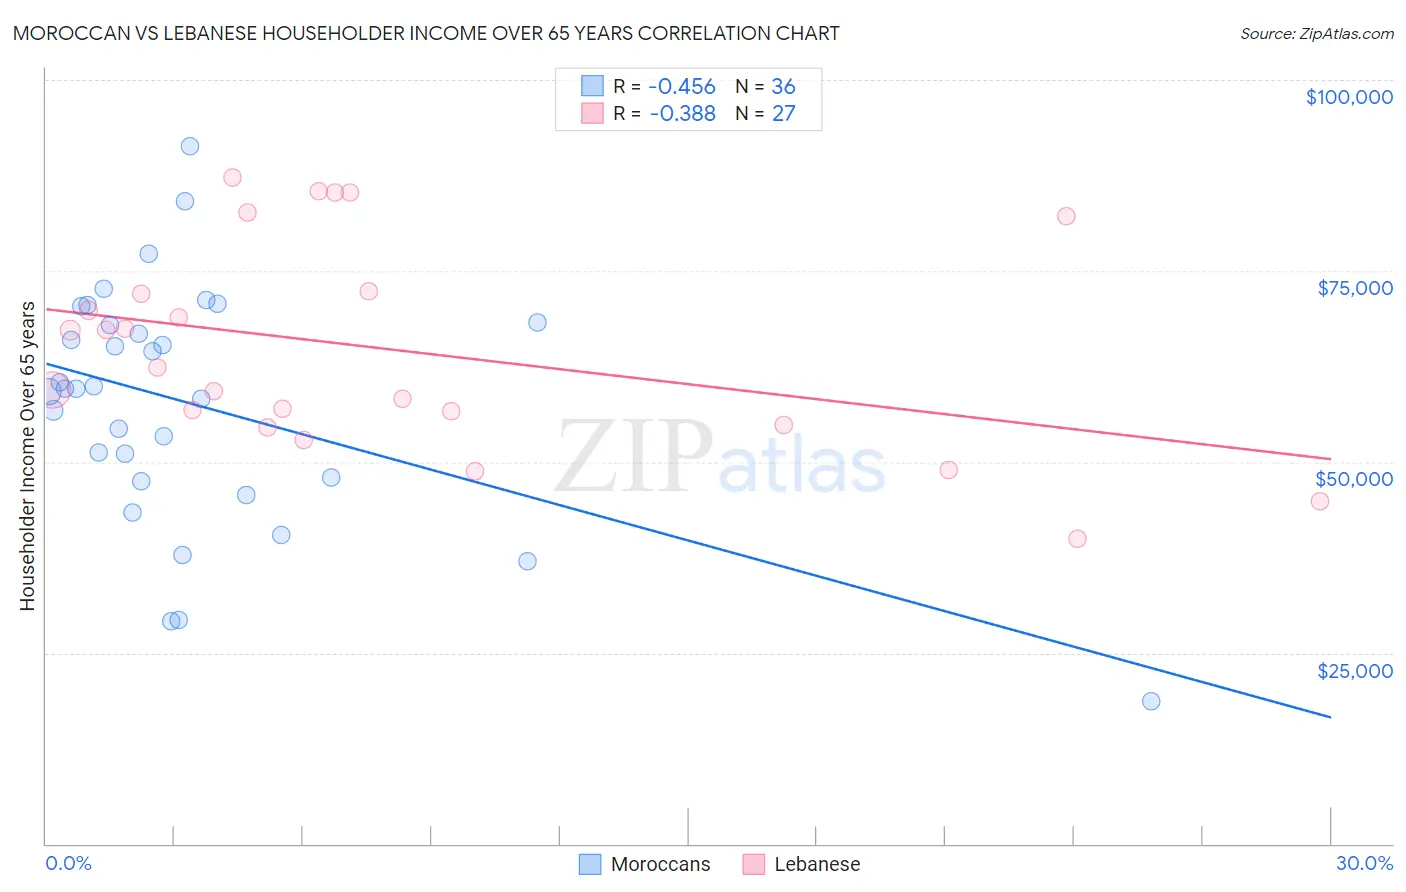
Moroccan vs Lebanese Householder Income Over 65 years Correlation Chart
The statistical analysis conducted on geographies consisting of 201,528,481 people shows a moderate negative correlation between the proportion of Moroccans and household income with householder over the age of 65 in the United States with a correlation coefficient (R) of -0.456 and weighted average of $59,683. Similarly, the statistical analysis conducted on geographies consisting of 400,240,263 people shows a mild negative correlation between the proportion of Lebanese and household income with householder over the age of 65 in the United States with a correlation coefficient (R) of -0.388 and weighted average of $62,287, a difference of 4.4%.
Householder Income Over 65 years Correlation Summary
| Measurement | Moroccan | Lebanese |
| Minimum | $18,625 | $39,905 |
| Maximum | $91,360 | $87,260 |
| Range | $72,735 | $47,355 |
| Mean | $57,561 | $64,724 |
| Median | $59,547 | $62,393 |
| Interquartile 25% (IQ1) | $47,767 | $54,830 |
| Interquartile 75% (IQ3) | $68,126 | $72,386 |
| Interquartile Range (IQR) | $20,359 | $17,556 |
| Standard Deviation (Sample) | $15,674 | $13,483 |
| Standard Deviation (Population) | $15,455 | $13,231 |
Similar Demographics by Householder Income Over 65 years
Demographics Similar to Moroccans by Householder Income Over 65 years
In terms of householder income over 65 years, the demographic groups most similar to Moroccans are Immigrants from Kenya ($59,710, a difference of 0.040%), Immigrants ($59,656, a difference of 0.050%), French ($59,656, a difference of 0.050%), German ($59,730, a difference of 0.080%), and Immigrants from Iraq ($59,824, a difference of 0.24%).
| Demographics | Rating | Rank | Householder Income Over 65 years |
| Belgians | 24.9 /100 | #191 | Fair $59,915 |
| South Americans | 23.8 /100 | #192 | Fair $59,854 |
| Immigrants | Costa Rica | 23.6 /100 | #193 | Fair $59,848 |
| Immigrants | Africa | 23.4 /100 | #194 | Fair $59,837 |
| Immigrants | Iraq | 23.2 /100 | #195 | Fair $59,824 |
| Germans | 21.5 /100 | #196 | Fair $59,730 |
| Immigrants | Kenya | 21.1 /100 | #197 | Fair $59,710 |
| Moroccans | 20.7 /100 | #198 | Fair $59,683 |
| Immigrants | Immigrants | 20.2 /100 | #199 | Fair $59,656 |
| French | 20.2 /100 | #200 | Fair $59,656 |
| Dutch | 18.3 /100 | #201 | Poor $59,539 |
| Finns | 18.2 /100 | #202 | Poor $59,535 |
| Scotch-Irish | 16.9 /100 | #203 | Poor $59,447 |
| Arapaho | 16.0 /100 | #204 | Poor $59,383 |
| Immigrants | Sudan | 14.2 /100 | #205 | Poor $59,248 |
Demographics Similar to Lebanese by Householder Income Over 65 years
In terms of householder income over 65 years, the demographic groups most similar to Lebanese are Immigrants from Kazakhstan ($62,292, a difference of 0.010%), Immigrants from Syria ($62,303, a difference of 0.030%), Arab ($62,266, a difference of 0.030%), Alaskan Athabascan ($62,330, a difference of 0.070%), and Canadian ($62,230, a difference of 0.090%).
| Demographics | Rating | Rank | Householder Income Over 65 years |
| Immigrants | Germany | 83.9 /100 | #132 | Excellent $62,544 |
| Immigrants | Northern Africa | 83.6 /100 | #133 | Excellent $62,522 |
| Immigrants | Brazil | 81.2 /100 | #134 | Excellent $62,364 |
| Immigrants | Chile | 81.0 /100 | #135 | Excellent $62,354 |
| Alaskan Athabascans | 80.6 /100 | #136 | Excellent $62,330 |
| Immigrants | Syria | 80.2 /100 | #137 | Excellent $62,303 |
| Immigrants | Kazakhstan | 80.0 /100 | #138 | Excellent $62,292 |
| Lebanese | 79.9 /100 | #139 | Good $62,287 |
| Arabs | 79.6 /100 | #140 | Good $62,266 |
| Canadians | 79.0 /100 | #141 | Good $62,230 |
| South American Indians | 78.7 /100 | #142 | Good $62,215 |
| Immigrants | Belarus | 77.8 /100 | #143 | Good $62,162 |
| Immigrants | Peru | 74.4 /100 | #144 | Good $61,988 |
| Immigrants | Uganda | 74.2 /100 | #145 | Good $61,976 |
| Immigrants | Southern Europe | 72.7 /100 | #146 | Good $61,902 |