Iranian vs Immigrants from Russia Per Capita Income
COMPARE
Iranian
Immigrants from Russia
Per Capita Income
Per Capita Income Comparison
Iranians
Immigrants from Russia
$58,786
PER CAPITA INCOME
100.0/ 100
METRIC RATING
2nd/ 347
METRIC RANK
$52,044
PER CAPITA INCOME
100.0/ 100
METRIC RATING
34th/ 347
METRIC RANK
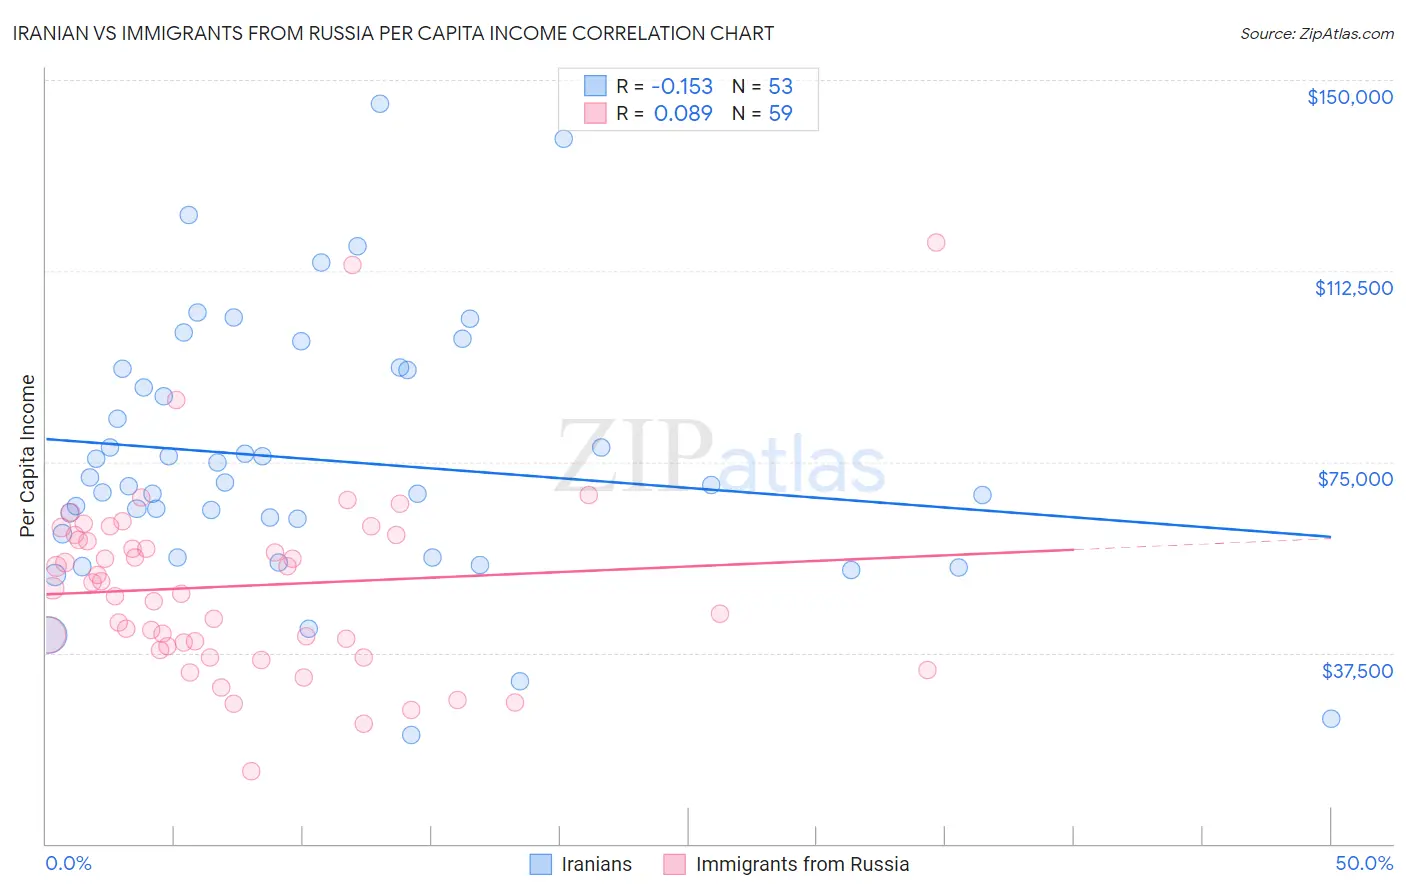
Iranian vs Immigrants from Russia Per Capita Income Correlation Chart
The statistical analysis conducted on geographies consisting of 316,916,136 people shows a poor negative correlation between the proportion of Iranians and per capita income in the United States with a correlation coefficient (R) of -0.153 and weighted average of $58,786. Similarly, the statistical analysis conducted on geographies consisting of 347,969,054 people shows a slight positive correlation between the proportion of Immigrants from Russia and per capita income in the United States with a correlation coefficient (R) of 0.089 and weighted average of $52,044, a difference of 13.0%.
Per Capita Income Correlation Summary
| Measurement | Iranian | Immigrants from Russia |
| Minimum | $21,346 | $14,227 |
| Maximum | $145,312 | $118,015 |
| Range | $123,966 | $103,788 |
| Mean | $75,439 | $50,649 |
| Median | $70,507 | $50,146 |
| Interquartile 25% (IQ1) | $58,523 | $38,836 |
| Interquartile 75% (IQ3) | $93,126 | $60,540 |
| Interquartile Range (IQR) | $34,604 | $21,704 |
| Standard Deviation (Sample) | $25,681 | $18,532 |
| Standard Deviation (Population) | $25,438 | $18,374 |
Similar Demographics by Per Capita Income
Demographics Similar to Iranians by Per Capita Income
In terms of per capita income, the demographic groups most similar to Iranians are Filipino ($59,066, a difference of 0.48%), Immigrants from Singapore ($58,353, a difference of 0.74%), Immigrants from Australia ($57,953, a difference of 1.4%), Immigrants from Iran ($57,759, a difference of 1.8%), and Immigrants from Taiwan ($57,742, a difference of 1.8%).
| Demographics | Rating | Rank | Per Capita Income |
| Filipinos | 100.0 /100 | #1 | Exceptional $59,066 |
| Iranians | 100.0 /100 | #2 | Exceptional $58,786 |
| Immigrants | Singapore | 100.0 /100 | #3 | Exceptional $58,353 |
| Immigrants | Australia | 100.0 /100 | #4 | Exceptional $57,953 |
| Immigrants | Iran | 100.0 /100 | #5 | Exceptional $57,759 |
| Immigrants | Taiwan | 100.0 /100 | #6 | Exceptional $57,742 |
| Immigrants | Israel | 100.0 /100 | #7 | Exceptional $57,384 |
| Immigrants | Hong Kong | 100.0 /100 | #8 | Exceptional $56,709 |
| Immigrants | Ireland | 100.0 /100 | #9 | Exceptional $56,584 |
| Okinawans | 100.0 /100 | #10 | Exceptional $55,817 |
| Eastern Europeans | 100.0 /100 | #11 | Exceptional $55,780 |
| Immigrants | Sweden | 100.0 /100 | #12 | Exceptional $55,582 |
| Immigrants | India | 100.0 /100 | #13 | Exceptional $55,268 |
| Immigrants | Belgium | 100.0 /100 | #14 | Exceptional $55,082 |
| Cypriots | 100.0 /100 | #15 | Exceptional $54,899 |
Demographics Similar to Immigrants from Russia by Per Capita Income
In terms of per capita income, the demographic groups most similar to Immigrants from Russia are Australian ($52,074, a difference of 0.060%), Burmese ($52,005, a difference of 0.070%), Immigrants from Greece ($51,891, a difference of 0.29%), Immigrants from Norway ($52,217, a difference of 0.33%), and Estonian ($51,875, a difference of 0.33%).
| Demographics | Rating | Rank | Per Capita Income |
| Immigrants | South Central Asia | 100.0 /100 | #27 | Exceptional $52,660 |
| Latvians | 100.0 /100 | #28 | Exceptional $52,649 |
| Israelis | 100.0 /100 | #29 | Exceptional $52,596 |
| Immigrants | Austria | 100.0 /100 | #30 | Exceptional $52,503 |
| Turks | 100.0 /100 | #31 | Exceptional $52,391 |
| Immigrants | Norway | 100.0 /100 | #32 | Exceptional $52,217 |
| Australians | 100.0 /100 | #33 | Exceptional $52,074 |
| Immigrants | Russia | 100.0 /100 | #34 | Exceptional $52,044 |
| Burmese | 100.0 /100 | #35 | Exceptional $52,005 |
| Immigrants | Greece | 100.0 /100 | #36 | Exceptional $51,891 |
| Estonians | 100.0 /100 | #37 | Exceptional $51,875 |
| Immigrants | Czechoslovakia | 100.0 /100 | #38 | Exceptional $51,770 |
| Cambodians | 100.0 /100 | #39 | Exceptional $51,731 |
| Immigrants | Korea | 100.0 /100 | #40 | Exceptional $51,671 |
| Immigrants | South Africa | 100.0 /100 | #41 | Exceptional $51,465 |