Tsimshian vs Immigrants from Guyana Householder Income Ages 25 - 44 years
COMPARE
Tsimshian
Immigrants from Guyana
Householder Income Ages 25 - 44 years
Householder Income Ages 25 - 44 years Comparison
Tsimshian
Immigrants from Guyana
$97,809
HOUSEHOLDER INCOME AGES 25 - 44 YEARS
85.8/ 100
METRIC RATING
133rd/ 347
METRIC RANK
$89,586
HOUSEHOLDER INCOME AGES 25 - 44 YEARS
5.9/ 100
METRIC RATING
223rd/ 347
METRIC RANK
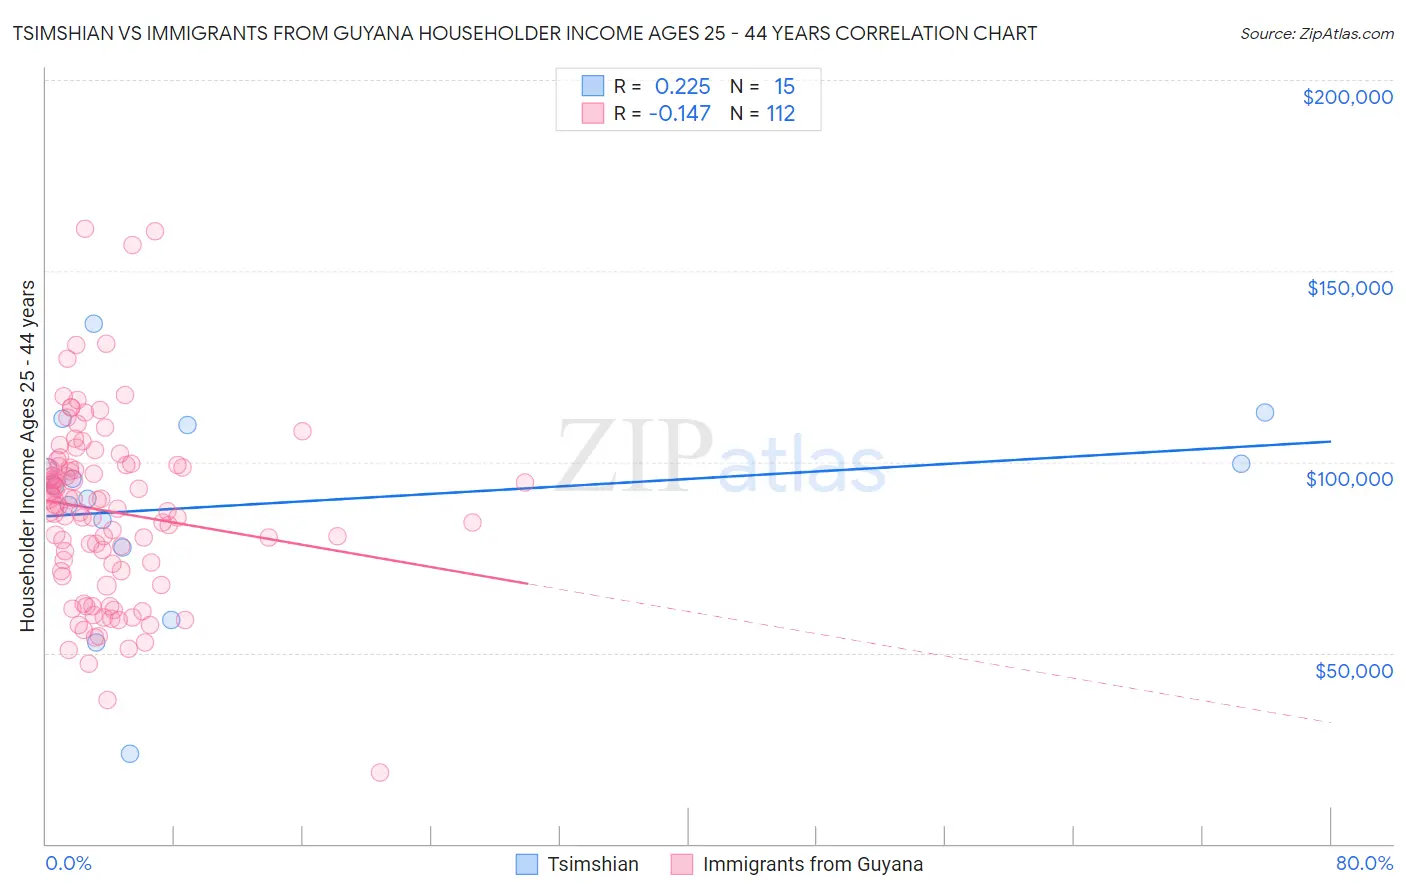
Tsimshian vs Immigrants from Guyana Householder Income Ages 25 - 44 years Correlation Chart
The statistical analysis conducted on geographies consisting of 15,621,525 people shows a weak positive correlation between the proportion of Tsimshian and household income with householder between the ages 25 and 44 in the United States with a correlation coefficient (R) of 0.225 and weighted average of $97,809. Similarly, the statistical analysis conducted on geographies consisting of 183,521,804 people shows a poor negative correlation between the proportion of Immigrants from Guyana and household income with householder between the ages 25 and 44 in the United States with a correlation coefficient (R) of -0.147 and weighted average of $89,586, a difference of 9.2%.
Householder Income Ages 25 - 44 years Correlation Summary
| Measurement | Tsimshian | Immigrants from Guyana |
| Minimum | $23,438 | $18,657 |
| Maximum | $136,250 | $161,089 |
| Range | $112,812 | $142,432 |
| Mean | $88,925 | $87,058 |
| Median | $93,749 | $88,583 |
| Interquartile 25% (IQ1) | $77,546 | $71,493 |
| Interquartile 75% (IQ3) | $109,750 | $98,895 |
| Interquartile Range (IQR) | $32,204 | $27,402 |
| Standard Deviation (Sample) | $27,608 | $23,727 |
| Standard Deviation (Population) | $26,672 | $23,620 |
Similar Demographics by Householder Income Ages 25 - 44 years
Demographics Similar to Tsimshian by Householder Income Ages 25 - 44 years
In terms of householder income ages 25 - 44 years, the demographic groups most similar to Tsimshian are Immigrants from Zimbabwe ($97,880, a difference of 0.070%), Immigrants from Albania ($97,929, a difference of 0.12%), Canadian ($97,625, a difference of 0.19%), Immigrants from Oceania ($97,623, a difference of 0.19%), and Hungarian ($97,544, a difference of 0.27%).
| Demographics | Rating | Rank | Householder Income Ages 25 - 44 years |
| British | 89.1 /100 | #126 | Excellent $98,359 |
| Serbians | 88.9 /100 | #127 | Excellent $98,320 |
| Europeans | 88.9 /100 | #128 | Excellent $98,310 |
| Brazilians | 88.6 /100 | #129 | Excellent $98,267 |
| Immigrants | Kuwait | 87.8 /100 | #130 | Excellent $98,122 |
| Immigrants | Albania | 86.6 /100 | #131 | Excellent $97,929 |
| Immigrants | Zimbabwe | 86.3 /100 | #132 | Excellent $97,880 |
| Tsimshian | 85.8 /100 | #133 | Excellent $97,809 |
| Canadians | 84.5 /100 | #134 | Excellent $97,625 |
| Immigrants | Oceania | 84.5 /100 | #135 | Excellent $97,623 |
| Hungarians | 83.9 /100 | #136 | Excellent $97,544 |
| Lebanese | 82.3 /100 | #137 | Excellent $97,339 |
| Arabs | 82.3 /100 | #138 | Excellent $97,336 |
| Immigrants | Peru | 82.2 /100 | #139 | Excellent $97,329 |
| Immigrants | Morocco | 82.0 /100 | #140 | Excellent $97,305 |
Demographics Similar to Immigrants from Guyana by Householder Income Ages 25 - 44 years
In terms of householder income ages 25 - 44 years, the demographic groups most similar to Immigrants from Guyana are Barbadian ($89,565, a difference of 0.020%), Immigrants from Ecuador ($89,673, a difference of 0.10%), Immigrants from Panama ($89,451, a difference of 0.15%), Immigrants from Iraq ($89,444, a difference of 0.16%), and Immigrants from Trinidad and Tobago ($89,748, a difference of 0.18%).
| Demographics | Rating | Rank | Householder Income Ages 25 - 44 years |
| Ghanaians | 7.9 /100 | #216 | Tragic $90,137 |
| Scotch-Irish | 7.3 /100 | #217 | Tragic $89,969 |
| Guyanese | 7.1 /100 | #218 | Tragic $89,940 |
| Delaware | 6.9 /100 | #219 | Tragic $89,876 |
| Trinidadians and Tobagonians | 6.8 /100 | #220 | Tragic $89,856 |
| Immigrants | Trinidad and Tobago | 6.5 /100 | #221 | Tragic $89,748 |
| Immigrants | Ecuador | 6.2 /100 | #222 | Tragic $89,673 |
| Immigrants | Guyana | 5.9 /100 | #223 | Tragic $89,586 |
| Barbadians | 5.9 /100 | #224 | Tragic $89,565 |
| Immigrants | Panama | 5.5 /100 | #225 | Tragic $89,451 |
| Immigrants | Iraq | 5.5 /100 | #226 | Tragic $89,444 |
| Immigrants | St. Vincent and the Grenadines | 4.1 /100 | #227 | Tragic $88,888 |
| Immigrants | Bosnia and Herzegovina | 4.0 /100 | #228 | Tragic $88,819 |
| Immigrants | Barbados | 3.7 /100 | #229 | Tragic $88,687 |
| Alaskan Athabascans | 3.3 /100 | #230 | Tragic $88,446 |