Slavic vs South American Indian Householder Income Ages 25 - 44 years
COMPARE
Slavic
South American Indian
Householder Income Ages 25 - 44 years
Householder Income Ages 25 - 44 years Comparison
Slavs
South American Indians
$96,377
HOUSEHOLDER INCOME AGES 25 - 44 YEARS
73.2/ 100
METRIC RATING
154th/ 347
METRIC RANK
$96,497
HOUSEHOLDER INCOME AGES 25 - 44 YEARS
74.5/ 100
METRIC RATING
152nd/ 347
METRIC RANK
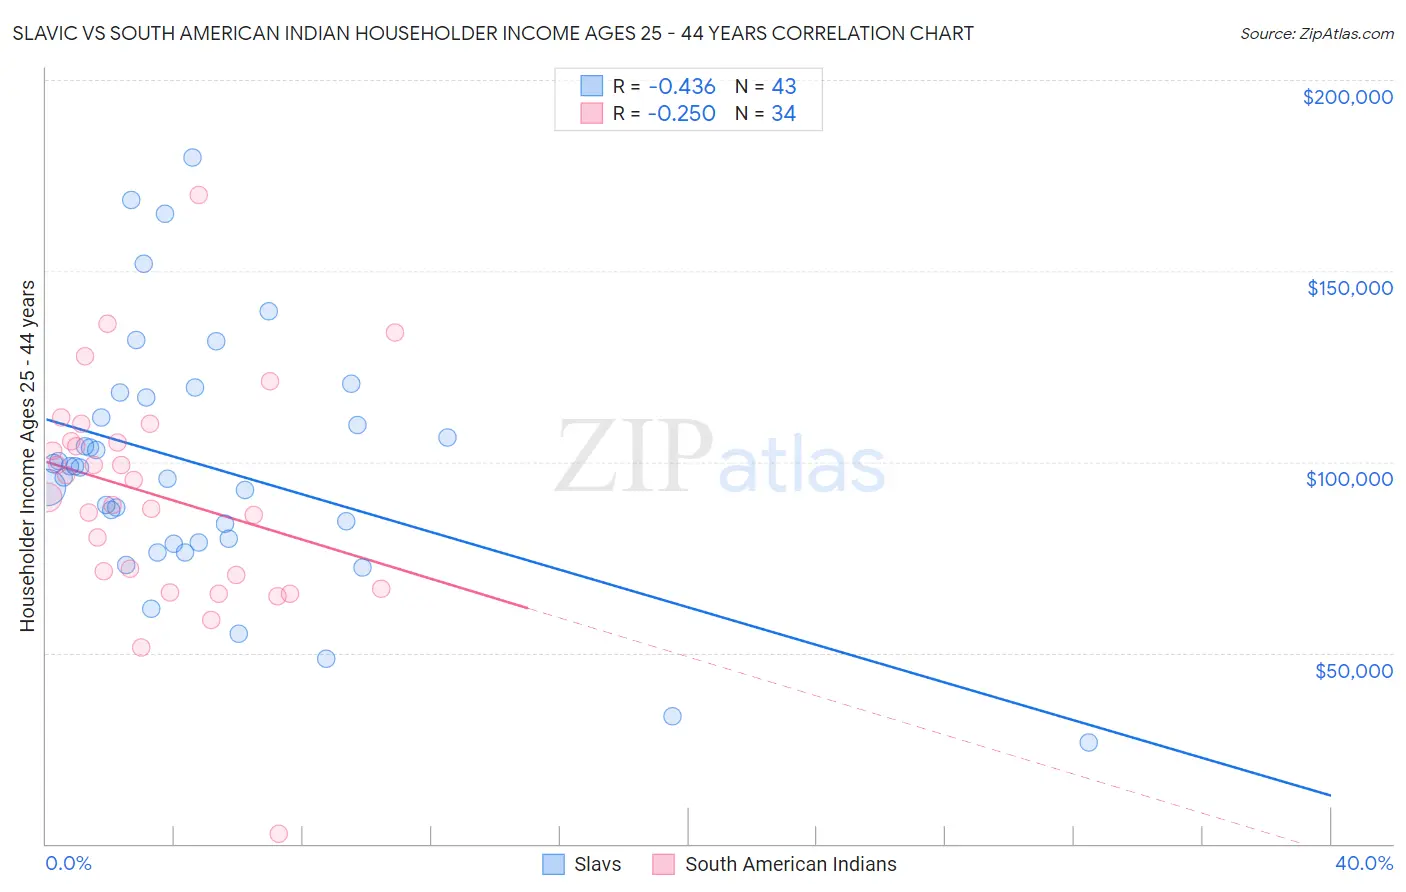
Slavic vs South American Indian Householder Income Ages 25 - 44 years Correlation Chart
The statistical analysis conducted on geographies consisting of 270,306,430 people shows a moderate negative correlation between the proportion of Slavs and household income with householder between the ages 25 and 44 in the United States with a correlation coefficient (R) of -0.436 and weighted average of $96,377. Similarly, the statistical analysis conducted on geographies consisting of 164,455,741 people shows a weak negative correlation between the proportion of South American Indians and household income with householder between the ages 25 and 44 in the United States with a correlation coefficient (R) of -0.250 and weighted average of $96,497, a difference of 0.12%.
Householder Income Ages 25 - 44 years Correlation Summary
| Measurement | Slavic | South American Indian |
| Minimum | $26,507 | $2,499 |
| Maximum | $179,830 | $170,036 |
| Range | $153,323 | $167,537 |
| Mean | $98,780 | $91,221 |
| Median | $98,521 | $92,899 |
| Interquartile 25% (IQ1) | $78,750 | $70,385 |
| Interquartile 75% (IQ3) | $116,887 | $105,466 |
| Interquartile Range (IQR) | $38,137 | $35,081 |
| Standard Deviation (Sample) | $32,452 | $29,879 |
| Standard Deviation (Population) | $32,072 | $29,437 |
Demographics Similar to Slavs and South American Indians by Householder Income Ages 25 - 44 years
In terms of householder income ages 25 - 44 years, the demographic groups most similar to Slavs are Slovene ($96,439, a difference of 0.060%), Czech ($96,525, a difference of 0.15%), Moroccan ($96,117, a difference of 0.27%), Ugandan ($96,667, a difference of 0.30%), and Basque ($96,709, a difference of 0.34%). Similarly, the demographic groups most similar to South American Indians are Czech ($96,525, a difference of 0.030%), Slovene ($96,439, a difference of 0.060%), Ugandan ($96,667, a difference of 0.18%), Basque ($96,709, a difference of 0.22%), and Irish ($96,730, a difference of 0.24%).
| Demographics | Rating | Rank | Householder Income Ages 25 - 44 years |
| Immigrants | Jordan | 81.0 /100 | #143 | Excellent $97,185 |
| Immigrants | Chile | 80.8 /100 | #144 | Excellent $97,159 |
| Norwegians | 78.2 /100 | #145 | Good $96,866 |
| Ethiopians | 77.8 /100 | #146 | Good $96,824 |
| Immigrants | Syria | 77.4 /100 | #147 | Good $96,789 |
| Irish | 76.9 /100 | #148 | Good $96,730 |
| Basques | 76.6 /100 | #149 | Good $96,709 |
| Ugandans | 76.2 /100 | #150 | Good $96,667 |
| Czechs | 74.8 /100 | #151 | Good $96,525 |
| South American Indians | 74.5 /100 | #152 | Good $96,497 |
| Slovenes | 73.9 /100 | #153 | Good $96,439 |
| Slavs | 73.2 /100 | #154 | Good $96,377 |
| Moroccans | 70.3 /100 | #155 | Good $96,117 |
| Immigrants | Germany | 67.9 /100 | #156 | Good $95,913 |
| Immigrants | Uganda | 65.2 /100 | #157 | Good $95,698 |
| Scandinavians | 63.9 /100 | #158 | Good $95,596 |
| Costa Ricans | 63.5 /100 | #159 | Good $95,565 |
| Icelanders | 63.4 /100 | #160 | Good $95,560 |
| Immigrants | Portugal | 62.8 /100 | #161 | Good $95,512 |
| Swiss | 62.8 /100 | #162 | Good $95,511 |
| Immigrants | Saudi Arabia | 62.0 /100 | #163 | Good $95,450 |