Slavic vs Scotch-Irish Householder Income Ages 25 - 44 years
COMPARE
Slavic
Scotch-Irish
Householder Income Ages 25 - 44 years
Householder Income Ages 25 - 44 years Comparison
Slavs
Scotch-Irish
$96,377
HOUSEHOLDER INCOME AGES 25 - 44 YEARS
73.2/ 100
METRIC RATING
154th/ 347
METRIC RANK
$89,969
HOUSEHOLDER INCOME AGES 25 - 44 YEARS
7.3/ 100
METRIC RATING
217th/ 347
METRIC RANK
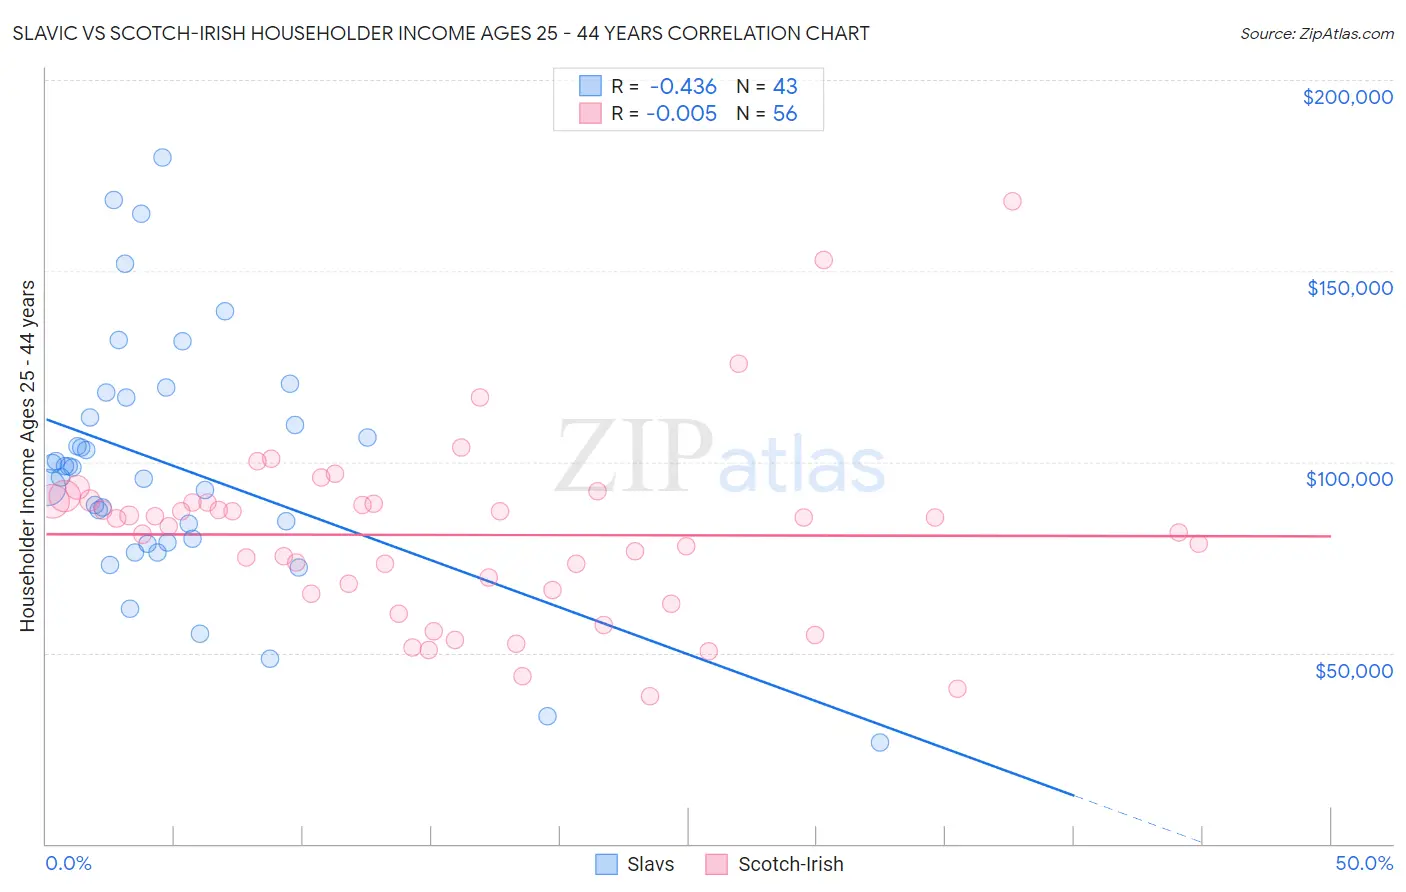
Slavic vs Scotch-Irish Householder Income Ages 25 - 44 years Correlation Chart
The statistical analysis conducted on geographies consisting of 270,306,430 people shows a moderate negative correlation between the proportion of Slavs and household income with householder between the ages 25 and 44 in the United States with a correlation coefficient (R) of -0.436 and weighted average of $96,377. Similarly, the statistical analysis conducted on geographies consisting of 544,063,779 people shows no correlation between the proportion of Scotch-Irish and household income with householder between the ages 25 and 44 in the United States with a correlation coefficient (R) of -0.005 and weighted average of $89,969, a difference of 7.1%.
Householder Income Ages 25 - 44 years Correlation Summary
| Measurement | Slavic | Scotch-Irish |
| Minimum | $26,507 | $38,615 |
| Maximum | $179,830 | $168,086 |
| Range | $153,323 | $129,471 |
| Mean | $98,780 | $80,873 |
| Median | $98,521 | $84,225 |
| Interquartile 25% (IQ1) | $78,750 | $65,999 |
| Interquartile 75% (IQ3) | $116,887 | $89,511 |
| Interquartile Range (IQR) | $38,137 | $23,512 |
| Standard Deviation (Sample) | $32,452 | $23,988 |
| Standard Deviation (Population) | $32,072 | $23,773 |
Similar Demographics by Householder Income Ages 25 - 44 years
Demographics Similar to Slavs by Householder Income Ages 25 - 44 years
In terms of householder income ages 25 - 44 years, the demographic groups most similar to Slavs are Slovene ($96,439, a difference of 0.060%), South American Indian ($96,497, a difference of 0.12%), Czech ($96,525, a difference of 0.15%), Moroccan ($96,117, a difference of 0.27%), and Ugandan ($96,667, a difference of 0.30%).
| Demographics | Rating | Rank | Householder Income Ages 25 - 44 years |
| Immigrants | Syria | 77.4 /100 | #147 | Good $96,789 |
| Irish | 76.9 /100 | #148 | Good $96,730 |
| Basques | 76.6 /100 | #149 | Good $96,709 |
| Ugandans | 76.2 /100 | #150 | Good $96,667 |
| Czechs | 74.8 /100 | #151 | Good $96,525 |
| South American Indians | 74.5 /100 | #152 | Good $96,497 |
| Slovenes | 73.9 /100 | #153 | Good $96,439 |
| Slavs | 73.2 /100 | #154 | Good $96,377 |
| Moroccans | 70.3 /100 | #155 | Good $96,117 |
| Immigrants | Germany | 67.9 /100 | #156 | Good $95,913 |
| Immigrants | Uganda | 65.2 /100 | #157 | Good $95,698 |
| Scandinavians | 63.9 /100 | #158 | Good $95,596 |
| Costa Ricans | 63.5 /100 | #159 | Good $95,565 |
| Icelanders | 63.4 /100 | #160 | Good $95,560 |
| Immigrants | Portugal | 62.8 /100 | #161 | Good $95,512 |
Demographics Similar to Scotch-Irish by Householder Income Ages 25 - 44 years
In terms of householder income ages 25 - 44 years, the demographic groups most similar to Scotch-Irish are Guyanese ($89,940, a difference of 0.030%), Delaware ($89,876, a difference of 0.10%), Trinidadian and Tobagonian ($89,856, a difference of 0.13%), Ghanaian ($90,137, a difference of 0.19%), and Panamanian ($90,193, a difference of 0.25%).
| Demographics | Rating | Rank | Householder Income Ages 25 - 44 years |
| Immigrants | Kenya | 10.9 /100 | #210 | Poor $90,767 |
| Iraqis | 10.8 /100 | #211 | Poor $90,764 |
| Hawaiians | 10.6 /100 | #212 | Poor $90,722 |
| Immigrants | Bangladesh | 9.3 /100 | #213 | Tragic $90,448 |
| Immigrants | Africa | 8.9 /100 | #214 | Tragic $90,372 |
| Panamanians | 8.1 /100 | #215 | Tragic $90,193 |
| Ghanaians | 7.9 /100 | #216 | Tragic $90,137 |
| Scotch-Irish | 7.3 /100 | #217 | Tragic $89,969 |
| Guyanese | 7.1 /100 | #218 | Tragic $89,940 |
| Delaware | 6.9 /100 | #219 | Tragic $89,876 |
| Trinidadians and Tobagonians | 6.8 /100 | #220 | Tragic $89,856 |
| Immigrants | Trinidad and Tobago | 6.5 /100 | #221 | Tragic $89,748 |
| Immigrants | Ecuador | 6.2 /100 | #222 | Tragic $89,673 |
| Immigrants | Guyana | 5.9 /100 | #223 | Tragic $89,586 |
| Barbadians | 5.9 /100 | #224 | Tragic $89,565 |