Slavic vs Immigrants from Hungary Median Earnings
COMPARE
Slavic
Immigrants from Hungary
Median Earnings
Median Earnings Comparison
Slavs
Immigrants from Hungary
$47,470
MEDIAN EARNINGS
81.1/ 100
METRIC RATING
153rd/ 347
METRIC RANK
$50,227
MEDIAN EARNINGS
99.5/ 100
METRIC RATING
84th/ 347
METRIC RANK
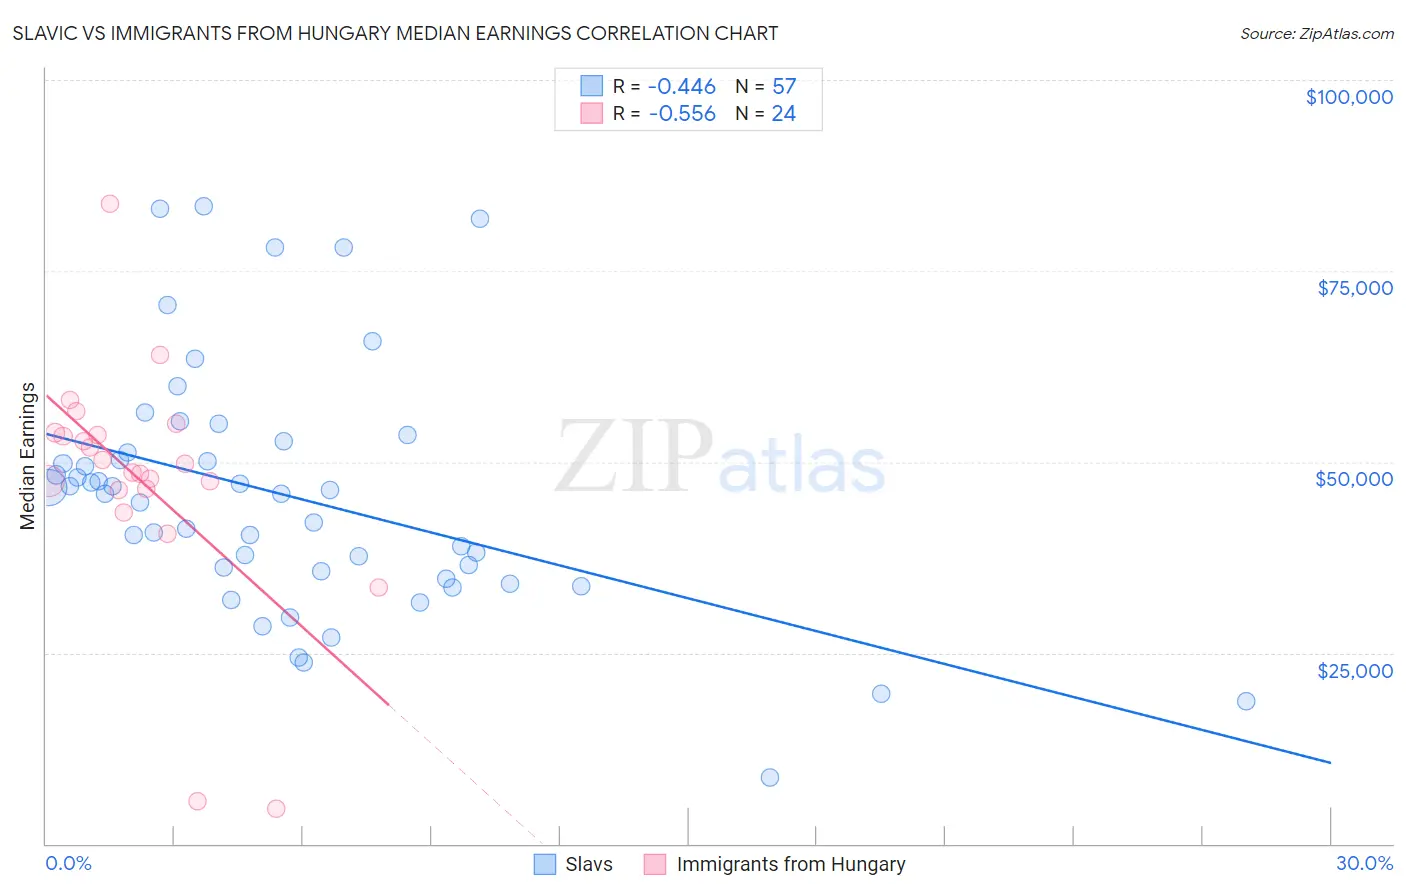
Slavic vs Immigrants from Hungary Median Earnings Correlation Chart
The statistical analysis conducted on geographies consisting of 270,868,378 people shows a moderate negative correlation between the proportion of Slavs and median earnings in the United States with a correlation coefficient (R) of -0.446 and weighted average of $47,470. Similarly, the statistical analysis conducted on geographies consisting of 195,705,454 people shows a substantial negative correlation between the proportion of Immigrants from Hungary and median earnings in the United States with a correlation coefficient (R) of -0.556 and weighted average of $50,227, a difference of 5.8%.
Median Earnings Correlation Summary
| Measurement | Slavic | Immigrants from Hungary |
| Minimum | $8,672 | $4,622 |
| Maximum | $83,496 | $83,751 |
| Range | $74,824 | $79,129 |
| Mean | $45,520 | $47,628 |
| Median | $45,848 | $49,169 |
| Interquartile 25% (IQ1) | $35,213 | $46,381 |
| Interquartile 75% (IQ3) | $51,961 | $53,646 |
| Interquartile Range (IQR) | $16,749 | $7,266 |
| Standard Deviation (Sample) | $16,076 | $15,967 |
| Standard Deviation (Population) | $15,935 | $15,631 |
Similar Demographics by Median Earnings
Demographics Similar to Slavs by Median Earnings
In terms of median earnings, the demographic groups most similar to Slavs are Immigrants from Germany ($47,566, a difference of 0.20%), Immigrants from Oceania ($47,617, a difference of 0.31%), Peruvian ($47,628, a difference of 0.33%), Immigrants from Portugal ($47,304, a difference of 0.35%), and Luxembourger ($47,640, a difference of 0.36%).
| Demographics | Rating | Rank | Median Earnings |
| Immigrants | Chile | 85.5 /100 | #146 | Excellent $47,697 |
| Immigrants | South Eastern Asia | 85.0 /100 | #147 | Excellent $47,671 |
| Immigrants | Eritrea | 84.8 /100 | #148 | Excellent $47,657 |
| Luxembourgers | 84.5 /100 | #149 | Excellent $47,640 |
| Peruvians | 84.2 /100 | #150 | Excellent $47,628 |
| Immigrants | Oceania | 84.1 /100 | #151 | Excellent $47,617 |
| Immigrants | Germany | 83.1 /100 | #152 | Excellent $47,566 |
| Slavs | 81.1 /100 | #153 | Excellent $47,470 |
| Immigrants | Portugal | 77.3 /100 | #154 | Good $47,304 |
| Immigrants | Vietnam | 76.7 /100 | #155 | Good $47,282 |
| Irish | 76.6 /100 | #156 | Good $47,276 |
| Czechs | 75.1 /100 | #157 | Good $47,221 |
| Slovaks | 71.7 /100 | #158 | Good $47,095 |
| Immigrants | Peru | 69.6 /100 | #159 | Good $47,025 |
| Alsatians | 69.6 /100 | #160 | Good $47,023 |
Demographics Similar to Immigrants from Hungary by Median Earnings
In terms of median earnings, the demographic groups most similar to Immigrants from Hungary are Immigrants from Kazakhstan ($50,225, a difference of 0.0%), Romanian ($50,244, a difference of 0.030%), Immigrants from Canada ($50,192, a difference of 0.070%), Immigrants from Moldova ($50,274, a difference of 0.090%), and Immigrants from Southern Europe ($50,280, a difference of 0.11%).
| Demographics | Rating | Rank | Median Earnings |
| Immigrants | Western Europe | 99.7 /100 | #77 | Exceptional $50,549 |
| Argentineans | 99.6 /100 | #78 | Exceptional $50,399 |
| Laotians | 99.6 /100 | #79 | Exceptional $50,343 |
| Ukrainians | 99.6 /100 | #80 | Exceptional $50,320 |
| Immigrants | Southern Europe | 99.6 /100 | #81 | Exceptional $50,280 |
| Immigrants | Moldova | 99.5 /100 | #82 | Exceptional $50,274 |
| Romanians | 99.5 /100 | #83 | Exceptional $50,244 |
| Immigrants | Hungary | 99.5 /100 | #84 | Exceptional $50,227 |
| Immigrants | Kazakhstan | 99.5 /100 | #85 | Exceptional $50,225 |
| Immigrants | Canada | 99.5 /100 | #86 | Exceptional $50,192 |
| Immigrants | Uzbekistan | 99.5 /100 | #87 | Exceptional $50,151 |
| Albanians | 99.4 /100 | #88 | Exceptional $50,116 |
| Immigrants | North America | 99.4 /100 | #89 | Exceptional $50,108 |
| Italians | 99.3 /100 | #90 | Exceptional $49,915 |
| Macedonians | 99.2 /100 | #91 | Exceptional $49,893 |