French American Indian vs Immigrants from Cambodia Householder Income Ages 45 - 64 years
COMPARE
French American Indian
Immigrants from Cambodia
Householder Income Ages 45 - 64 years
Householder Income Ages 45 - 64 years Comparison
French American Indians
Immigrants from Cambodia
$89,811
HOUSEHOLDER INCOME AGES 45 - 64 YEARS
0.5/ 100
METRIC RATING
256th/ 347
METRIC RANK
$96,537
HOUSEHOLDER INCOME AGES 45 - 64 YEARS
13.0/ 100
METRIC RATING
211th/ 347
METRIC RANK
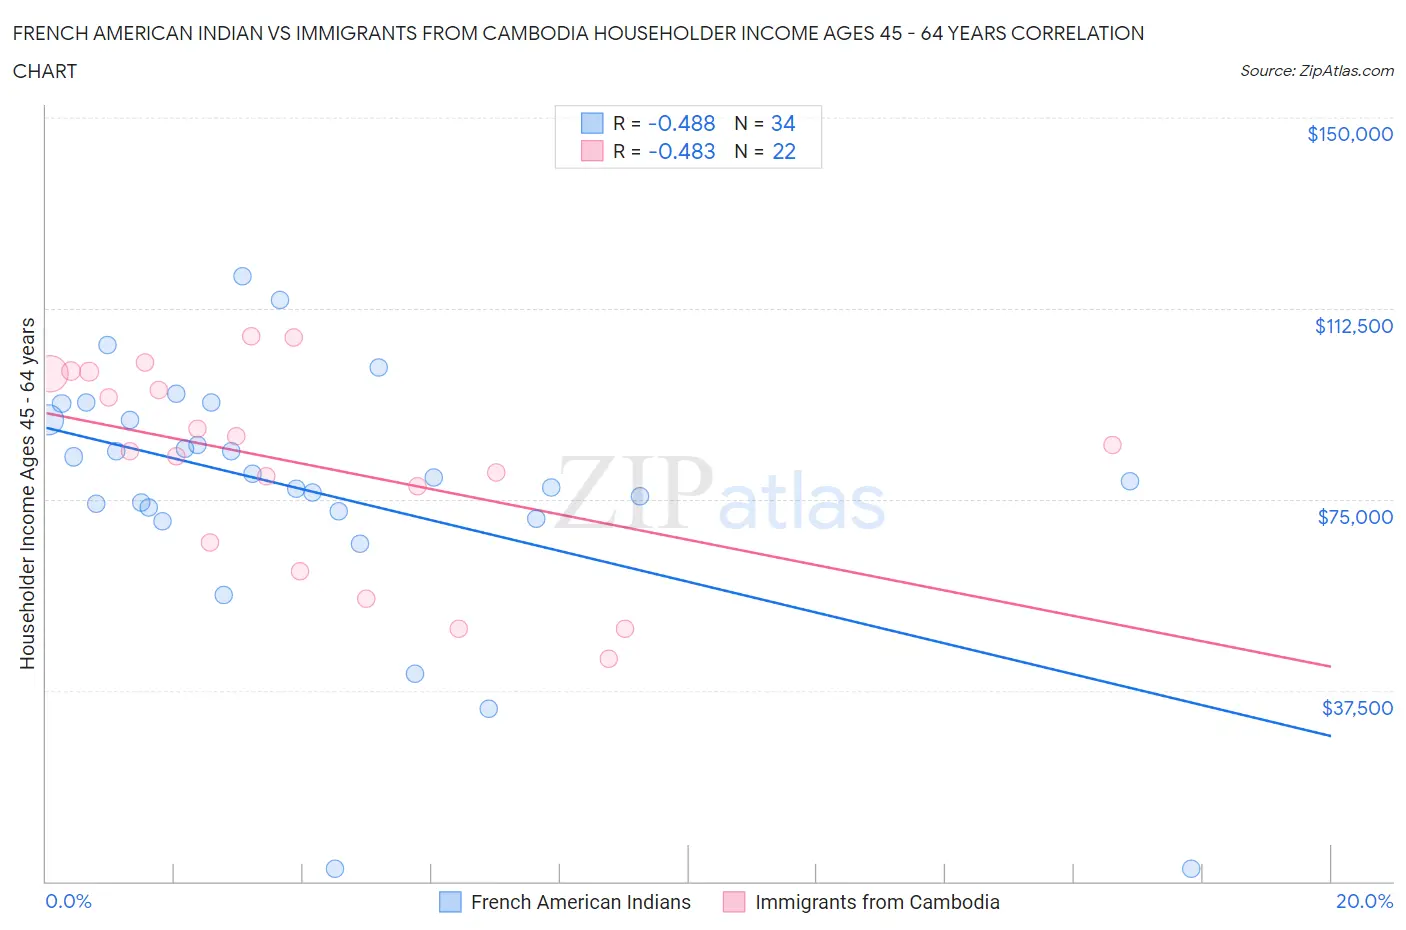
French American Indian vs Immigrants from Cambodia Householder Income Ages 45 - 64 years Correlation Chart
The statistical analysis conducted on geographies consisting of 131,896,651 people shows a moderate negative correlation between the proportion of French American Indians and household income with householder between the ages 45 and 64 in the United States with a correlation coefficient (R) of -0.488 and weighted average of $89,811. Similarly, the statistical analysis conducted on geographies consisting of 205,043,738 people shows a moderate negative correlation between the proportion of Immigrants from Cambodia and household income with householder between the ages 45 and 64 in the United States with a correlation coefficient (R) of -0.483 and weighted average of $96,537, a difference of 7.5%.
Householder Income Ages 45 - 64 years Correlation Summary
| Measurement | French American Indian | Immigrants from Cambodia |
| Minimum | $2,499 | $43,614 |
| Maximum | $118,854 | $107,055 |
| Range | $116,355 | $63,441 |
| Mean | $76,575 | $81,812 |
| Median | $78,869 | $85,046 |
| Interquartile 25% (IQ1) | $72,546 | $66,651 |
| Interquartile 75% (IQ3) | $90,690 | $99,554 |
| Interquartile Range (IQR) | $18,144 | $32,903 |
| Standard Deviation (Sample) | $25,412 | $19,590 |
| Standard Deviation (Population) | $25,035 | $19,140 |
Similar Demographics by Householder Income Ages 45 - 64 years
Demographics Similar to French American Indians by Householder Income Ages 45 - 64 years
In terms of householder income ages 45 - 64 years, the demographic groups most similar to French American Indians are West Indian ($89,906, a difference of 0.11%), Immigrants from Guyana ($90,186, a difference of 0.42%), German Russian ($89,398, a difference of 0.46%), Immigrants from Barbados ($89,394, a difference of 0.47%), and Barbadian ($90,266, a difference of 0.51%).
| Demographics | Rating | Rank | Householder Income Ages 45 - 64 years |
| Mexican American Indians | 0.8 /100 | #249 | Tragic $90,811 |
| Sub-Saharan Africans | 0.8 /100 | #250 | Tragic $90,691 |
| Americans | 0.7 /100 | #251 | Tragic $90,536 |
| Marshallese | 0.7 /100 | #252 | Tragic $90,455 |
| Barbadians | 0.6 /100 | #253 | Tragic $90,266 |
| Immigrants | Guyana | 0.6 /100 | #254 | Tragic $90,186 |
| West Indians | 0.5 /100 | #255 | Tragic $89,906 |
| French American Indians | 0.5 /100 | #256 | Tragic $89,811 |
| German Russians | 0.4 /100 | #257 | Tragic $89,398 |
| Immigrants | Barbados | 0.4 /100 | #258 | Tragic $89,394 |
| Immigrants | Nicaragua | 0.4 /100 | #259 | Tragic $89,108 |
| Liberians | 0.3 /100 | #260 | Tragic $88,929 |
| Belizeans | 0.3 /100 | #261 | Tragic $88,684 |
| Somalis | 0.3 /100 | #262 | Tragic $88,600 |
| Immigrants | Senegal | 0.3 /100 | #263 | Tragic $88,421 |
Demographics Similar to Immigrants from Cambodia by Householder Income Ages 45 - 64 years
In terms of householder income ages 45 - 64 years, the demographic groups most similar to Immigrants from Cambodia are Venezuelan ($96,460, a difference of 0.080%), Tsimshian ($96,783, a difference of 0.26%), Japanese ($96,834, a difference of 0.31%), Immigrants from Uruguay ($96,086, a difference of 0.47%), and Panamanian ($96,066, a difference of 0.49%).
| Demographics | Rating | Rank | Householder Income Ages 45 - 64 years |
| Immigrants | Eritrea | 18.6 /100 | #204 | Poor $97,373 |
| Immigrants | Colombia | 18.0 /100 | #205 | Poor $97,290 |
| Immigrants | Africa | 17.9 /100 | #206 | Poor $97,284 |
| Ghanaians | 17.9 /100 | #207 | Poor $97,277 |
| Scotch-Irish | 16.4 /100 | #208 | Poor $97,073 |
| Japanese | 14.8 /100 | #209 | Poor $96,834 |
| Tsimshian | 14.5 /100 | #210 | Poor $96,783 |
| Immigrants | Cambodia | 13.0 /100 | #211 | Poor $96,537 |
| Venezuelans | 12.6 /100 | #212 | Poor $96,460 |
| Immigrants | Uruguay | 10.7 /100 | #213 | Poor $96,086 |
| Panamanians | 10.6 /100 | #214 | Poor $96,066 |
| Nigerians | 8.2 /100 | #215 | Tragic $95,492 |
| Immigrants | Venezuela | 7.6 /100 | #216 | Tragic $95,342 |
| Immigrants | Ghana | 6.4 /100 | #217 | Tragic $94,982 |
| Delaware | 6.2 /100 | #218 | Tragic $94,914 |