Slavic vs Immigrants from Cambodia Disability Age Over 75
COMPARE
Slavic
Immigrants from Cambodia
Disability Age Over 75
Disability Age Over 75 Comparison
Slavs
Immigrants from Cambodia
46.1%
DISABILITY AGE OVER 75
98.9/ 100
METRIC RATING
76th/ 347
METRIC RANK
50.0%
DISABILITY AGE OVER 75
0.0/ 100
METRIC RATING
294th/ 347
METRIC RANK
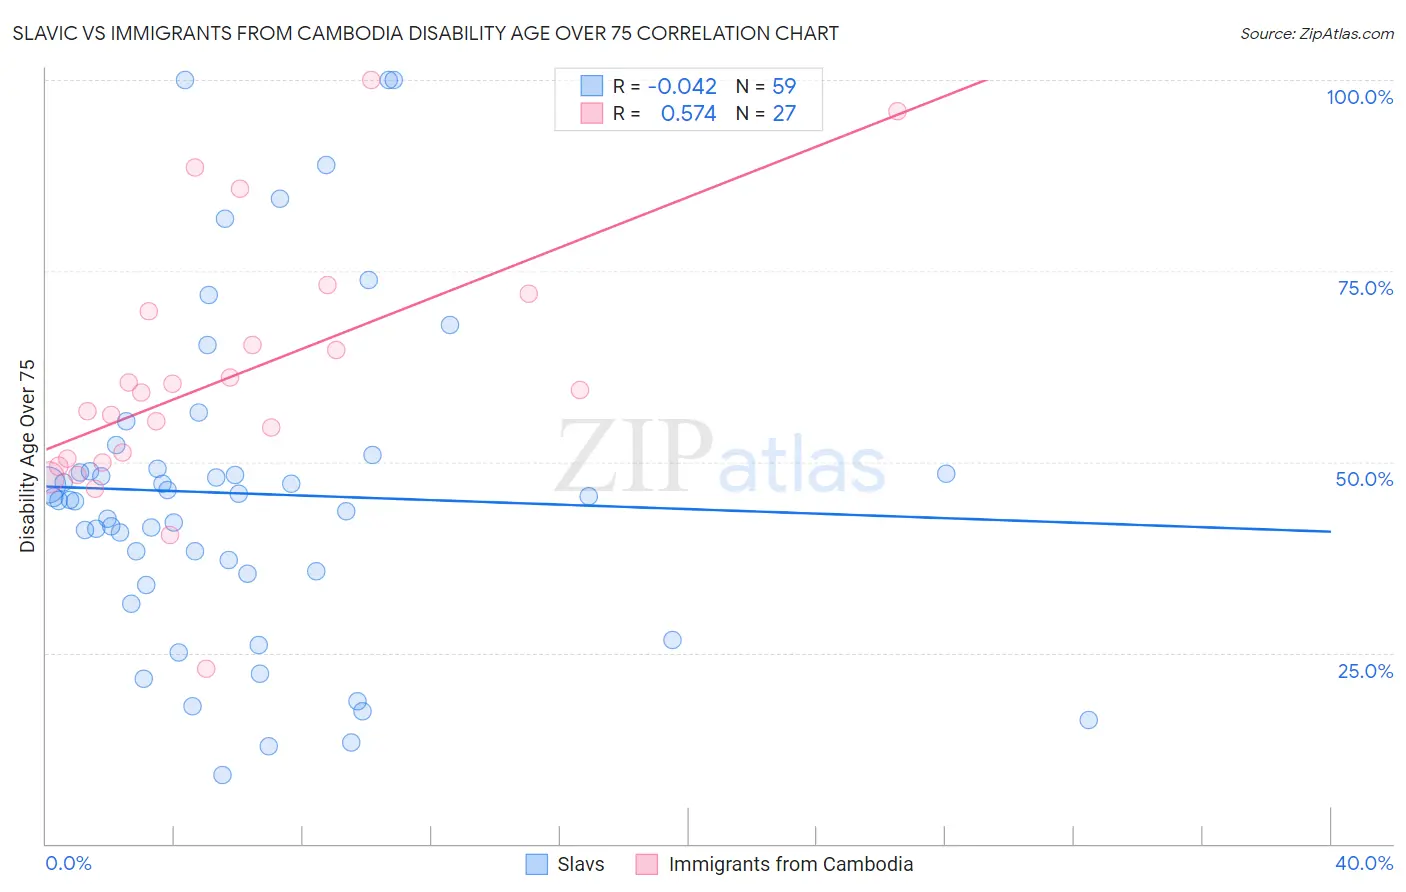
Slavic vs Immigrants from Cambodia Disability Age Over 75 Correlation Chart
The statistical analysis conducted on geographies consisting of 270,699,743 people shows no correlation between the proportion of Slavs and percentage of population with a disability over the age of 75 in the United States with a correlation coefficient (R) of -0.042 and weighted average of 46.1%. Similarly, the statistical analysis conducted on geographies consisting of 205,096,064 people shows a substantial positive correlation between the proportion of Immigrants from Cambodia and percentage of population with a disability over the age of 75 in the United States with a correlation coefficient (R) of 0.574 and weighted average of 50.0%, a difference of 8.4%.
Disability Age Over 75 Correlation Summary
| Measurement | Slavic | Immigrants from Cambodia |
| Minimum | 9.0% | 22.9% |
| Maximum | 100.0% | 100.0% |
| Range | 91.0% | 77.1% |
| Mean | 45.9% | 60.9% |
| Median | 45.1% | 59.1% |
| Interquartile 25% (IQ1) | 35.3% | 50.0% |
| Interquartile 75% (IQ3) | 49.1% | 69.8% |
| Interquartile Range (IQR) | 13.8% | 19.8% |
| Standard Deviation (Sample) | 21.2% | 17.0% |
| Standard Deviation (Population) | 21.0% | 16.7% |
Similar Demographics by Disability Age Over 75
Demographics Similar to Slavs by Disability Age Over 75
In terms of disability age over 75, the demographic groups most similar to Slavs are Serbian (46.1%, a difference of 0.010%), Immigrants from Eastern Asia (46.2%, a difference of 0.040%), Egyptian (46.1%, a difference of 0.050%), Immigrants from Western Europe (46.2%, a difference of 0.050%), and Cambodian (46.1%, a difference of 0.090%).
| Demographics | Rating | Rank | Disability Age Over 75 |
| Immigrants | Romania | 99.3 /100 | #69 | Exceptional 46.0% |
| Jordanians | 99.2 /100 | #70 | Exceptional 46.1% |
| Immigrants | Sri Lanka | 99.2 /100 | #71 | Exceptional 46.1% |
| Immigrants | Hungary | 99.1 /100 | #72 | Exceptional 46.1% |
| Cambodians | 99.1 /100 | #73 | Exceptional 46.1% |
| Egyptians | 99.0 /100 | #74 | Exceptional 46.1% |
| Serbians | 99.0 /100 | #75 | Exceptional 46.1% |
| Slavs | 98.9 /100 | #76 | Exceptional 46.1% |
| Immigrants | Eastern Asia | 98.9 /100 | #77 | Exceptional 46.2% |
| Immigrants | Western Europe | 98.8 /100 | #78 | Exceptional 46.2% |
| Swiss | 98.8 /100 | #79 | Exceptional 46.2% |
| Soviet Union | 98.8 /100 | #80 | Exceptional 46.2% |
| New Zealanders | 98.8 /100 | #81 | Exceptional 46.2% |
| Immigrants | Latvia | 98.7 /100 | #82 | Exceptional 46.2% |
| Argentineans | 98.7 /100 | #83 | Exceptional 46.2% |
Demographics Similar to Immigrants from Cambodia by Disability Age Over 75
In terms of disability age over 75, the demographic groups most similar to Immigrants from Cambodia are Spanish American (50.0%, a difference of 0.040%), Mexican American Indian (50.0%, a difference of 0.080%), Armenian (50.0%, a difference of 0.10%), Spanish American Indian (49.9%, a difference of 0.12%), and Marshallese (50.1%, a difference of 0.16%).
| Demographics | Rating | Rank | Disability Age Over 75 |
| Sioux | 0.0 /100 | #287 | Tragic 49.7% |
| Yaqui | 0.0 /100 | #288 | Tragic 49.8% |
| Osage | 0.0 /100 | #289 | Tragic 49.8% |
| Puget Sound Salish | 0.0 /100 | #290 | Tragic 49.8% |
| Arapaho | 0.0 /100 | #291 | Tragic 49.8% |
| Shoshone | 0.0 /100 | #292 | Tragic 49.9% |
| Spanish American Indians | 0.0 /100 | #293 | Tragic 49.9% |
| Immigrants | Cambodia | 0.0 /100 | #294 | Tragic 50.0% |
| Spanish Americans | 0.0 /100 | #295 | Tragic 50.0% |
| Mexican American Indians | 0.0 /100 | #296 | Tragic 50.0% |
| Armenians | 0.0 /100 | #297 | Tragic 50.0% |
| Marshallese | 0.0 /100 | #298 | Tragic 50.1% |
| Immigrants | Micronesia | 0.0 /100 | #299 | Tragic 50.1% |
| Cape Verdeans | 0.0 /100 | #300 | Tragic 50.1% |
| Dominicans | 0.0 /100 | #301 | Tragic 50.2% |