Sioux vs Subsaharan African Householder Income Over 65 years
COMPARE
Sioux
Subsaharan African
Householder Income Over 65 years
Householder Income Over 65 years Comparison
Sioux
Sub-Saharan Africans
$52,509
HOUSEHOLDER INCOME OVER 65 YEARS
0.0/ 100
METRIC RATING
310th/ 347
METRIC RANK
$56,615
HOUSEHOLDER INCOME OVER 65 YEARS
1.0/ 100
METRIC RATING
240th/ 347
METRIC RANK
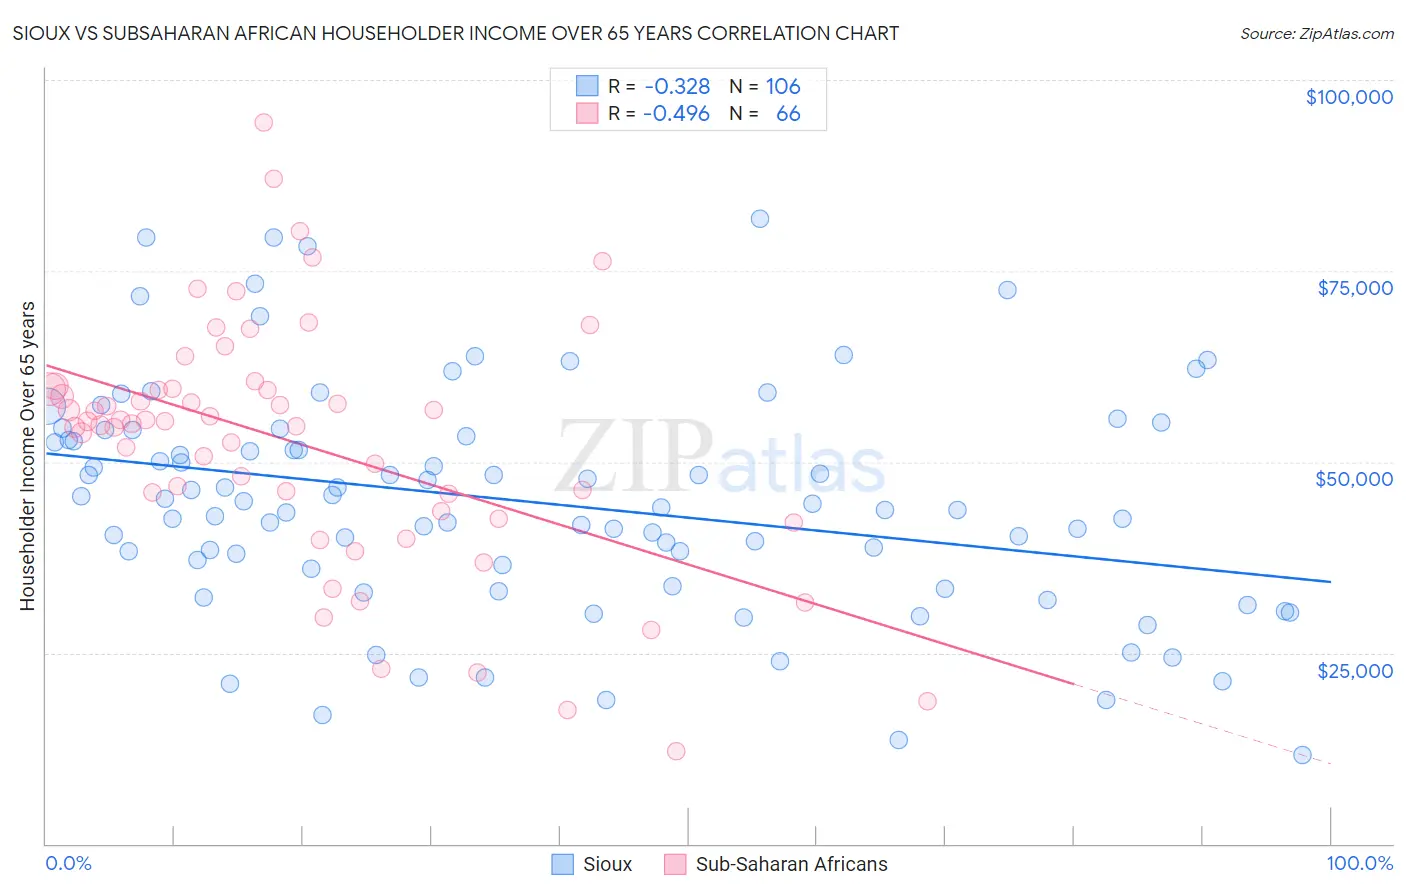
Sioux vs Subsaharan African Householder Income Over 65 years Correlation Chart
The statistical analysis conducted on geographies consisting of 233,494,495 people shows a mild negative correlation between the proportion of Sioux and household income with householder over the age of 65 in the United States with a correlation coefficient (R) of -0.328 and weighted average of $52,509. Similarly, the statistical analysis conducted on geographies consisting of 505,008,485 people shows a moderate negative correlation between the proportion of Sub-Saharan Africans and household income with householder over the age of 65 in the United States with a correlation coefficient (R) of -0.496 and weighted average of $56,615, a difference of 7.8%.
Householder Income Over 65 years Correlation Summary
| Measurement | Sioux | Subsaharan African |
| Minimum | $11,667 | $12,049 |
| Maximum | $81,875 | $94,427 |
| Range | $70,208 | $82,378 |
| Mean | $44,773 | $52,341 |
| Median | $44,286 | $55,146 |
| Interquartile 25% (IQ1) | $36,021 | $43,507 |
| Interquartile 75% (IQ3) | $53,333 | $59,521 |
| Interquartile Range (IQR) | $17,312 | $16,014 |
| Standard Deviation (Sample) | $14,854 | $16,149 |
| Standard Deviation (Population) | $14,783 | $16,026 |
Similar Demographics by Householder Income Over 65 years
Demographics Similar to Sioux by Householder Income Over 65 years
In terms of householder income over 65 years, the demographic groups most similar to Sioux are Honduran ($52,634, a difference of 0.24%), Seminole ($52,373, a difference of 0.26%), Immigrants from Mexico ($52,801, a difference of 0.56%), Hispanic or Latino ($52,832, a difference of 0.62%), and Pennsylvania German ($52,888, a difference of 0.72%).
| Demographics | Rating | Rank | Householder Income Over 65 years |
| Choctaw | 0.0 /100 | #303 | Tragic $53,060 |
| Ute | 0.0 /100 | #304 | Tragic $52,949 |
| Pueblo | 0.0 /100 | #305 | Tragic $52,930 |
| Pennsylvania Germans | 0.0 /100 | #306 | Tragic $52,888 |
| Hispanics or Latinos | 0.0 /100 | #307 | Tragic $52,832 |
| Immigrants | Mexico | 0.0 /100 | #308 | Tragic $52,801 |
| Hondurans | 0.0 /100 | #309 | Tragic $52,634 |
| Sioux | 0.0 /100 | #310 | Tragic $52,509 |
| Seminole | 0.0 /100 | #311 | Tragic $52,373 |
| Immigrants | Azores | 0.0 /100 | #312 | Tragic $52,121 |
| Immigrants | Nicaragua | 0.0 /100 | #313 | Tragic $52,085 |
| Natives/Alaskans | 0.0 /100 | #314 | Tragic $52,081 |
| U.S. Virgin Islanders | 0.0 /100 | #315 | Tragic $52,072 |
| Creek | 0.0 /100 | #316 | Tragic $51,949 |
| Immigrants | St. Vincent and the Grenadines | 0.0 /100 | #317 | Tragic $51,922 |
Demographics Similar to Sub-Saharan Africans by Householder Income Over 65 years
In terms of householder income over 65 years, the demographic groups most similar to Sub-Saharan Africans are Immigrants from Laos ($56,722, a difference of 0.19%), Immigrants from Guyana ($56,495, a difference of 0.21%), Fijian ($56,768, a difference of 0.27%), Yaqui ($56,417, a difference of 0.35%), and Guyanese ($56,351, a difference of 0.47%).
| Demographics | Rating | Rank | Householder Income Over 65 years |
| Immigrants | Western Africa | 1.7 /100 | #233 | Tragic $57,119 |
| Immigrants | Burma/Myanmar | 1.7 /100 | #234 | Tragic $57,114 |
| Spanish Americans | 1.6 /100 | #235 | Tragic $57,021 |
| Immigrants | Uruguay | 1.5 /100 | #236 | Tragic $56,975 |
| Immigrants | Panama | 1.5 /100 | #237 | Tragic $56,944 |
| Fijians | 1.2 /100 | #238 | Tragic $56,768 |
| Immigrants | Laos | 1.2 /100 | #239 | Tragic $56,722 |
| Sub-Saharan Africans | 1.0 /100 | #240 | Tragic $56,615 |
| Immigrants | Guyana | 0.9 /100 | #241 | Tragic $56,495 |
| Yaqui | 0.8 /100 | #242 | Tragic $56,417 |
| Guyanese | 0.8 /100 | #243 | Tragic $56,351 |
| Hmong | 0.8 /100 | #244 | Tragic $56,339 |
| Immigrants | Uzbekistan | 0.8 /100 | #245 | Tragic $56,331 |
| Central Americans | 0.8 /100 | #246 | Tragic $56,321 |
| Yakama | 0.7 /100 | #247 | Tragic $56,234 |