Immigrants from Asia vs Subsaharan African Householder Income Over 65 years
COMPARE
Immigrants from Asia
Subsaharan African
Householder Income Over 65 years
Householder Income Over 65 years Comparison
Immigrants from Asia
Sub-Saharan Africans
$67,594
HOUSEHOLDER INCOME OVER 65 YEARS
99.9/ 100
METRIC RATING
40th/ 347
METRIC RANK
$56,615
HOUSEHOLDER INCOME OVER 65 YEARS
1.0/ 100
METRIC RATING
240th/ 347
METRIC RANK
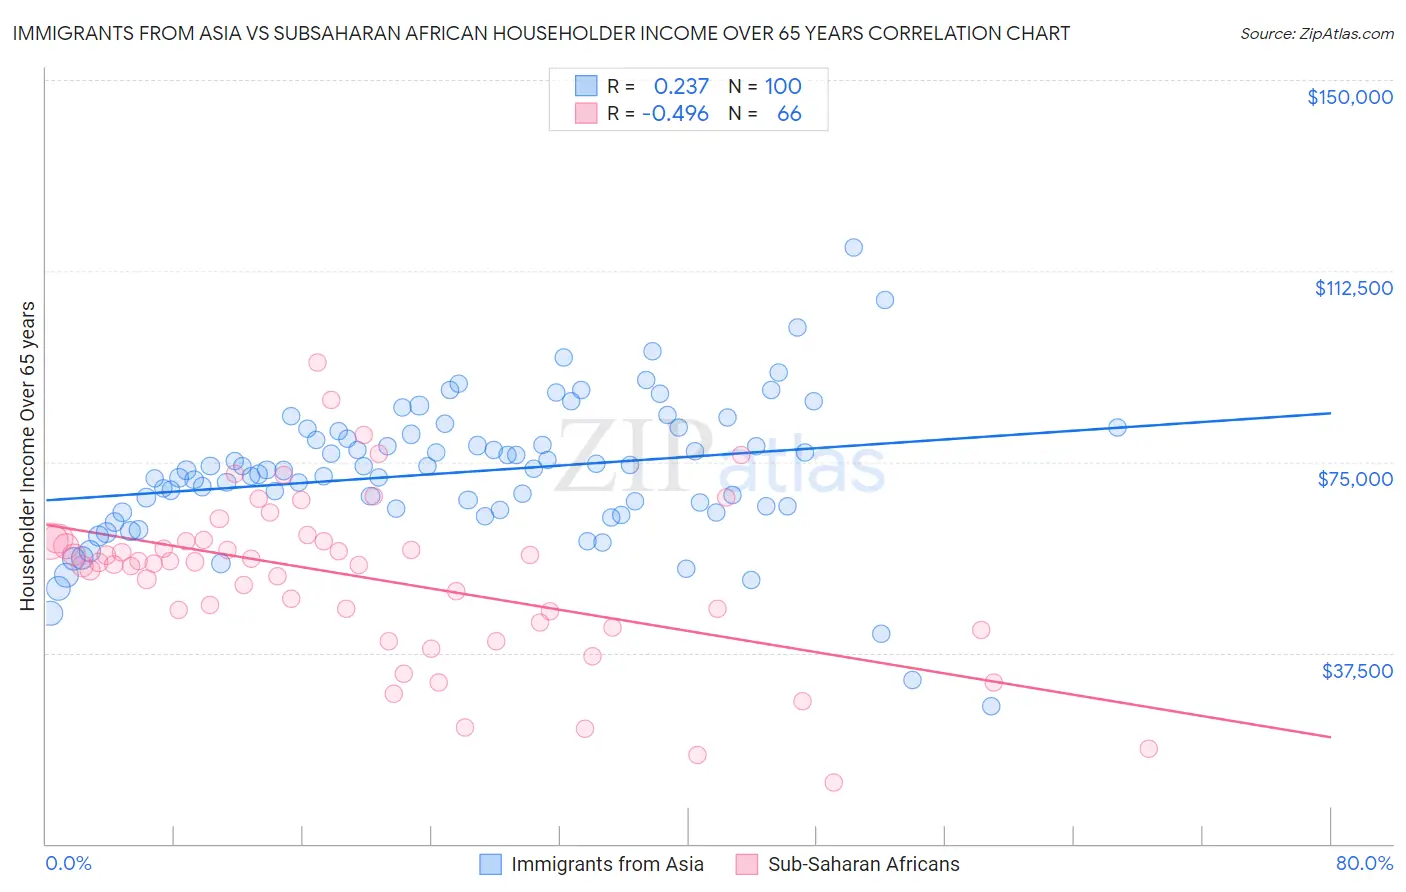
Immigrants from Asia vs Subsaharan African Householder Income Over 65 years Correlation Chart
The statistical analysis conducted on geographies consisting of 545,057,225 people shows a weak positive correlation between the proportion of Immigrants from Asia and household income with householder over the age of 65 in the United States with a correlation coefficient (R) of 0.237 and weighted average of $67,594. Similarly, the statistical analysis conducted on geographies consisting of 505,008,485 people shows a moderate negative correlation between the proportion of Sub-Saharan Africans and household income with householder over the age of 65 in the United States with a correlation coefficient (R) of -0.496 and weighted average of $56,615, a difference of 19.4%.
Householder Income Over 65 years Correlation Summary
| Measurement | Immigrants from Asia | Subsaharan African |
| Minimum | $26,908 | $12,049 |
| Maximum | $117,045 | $94,427 |
| Range | $90,137 | $82,378 |
| Mean | $72,900 | $52,341 |
| Median | $73,419 | $55,146 |
| Interquartile 25% (IQ1) | $65,605 | $43,507 |
| Interquartile 75% (IQ3) | $80,756 | $59,521 |
| Interquartile Range (IQR) | $15,151 | $16,014 |
| Standard Deviation (Sample) | $13,981 | $16,149 |
| Standard Deviation (Population) | $13,911 | $16,026 |
Similar Demographics by Householder Income Over 65 years
Demographics Similar to Immigrants from Asia by Householder Income Over 65 years
In terms of householder income over 65 years, the demographic groups most similar to Immigrants from Asia are Russian ($67,626, a difference of 0.050%), Korean ($67,472, a difference of 0.18%), New Zealander ($67,333, a difference of 0.39%), Latvian ($67,326, a difference of 0.40%), and Estonian ($67,926, a difference of 0.49%).
| Demographics | Rating | Rank | Householder Income Over 65 years |
| Immigrants | Denmark | 100.0 /100 | #33 | Exceptional $68,801 |
| Immigrants | Ireland | 100.0 /100 | #34 | Exceptional $68,495 |
| Tongans | 100.0 /100 | #35 | Exceptional $68,235 |
| Immigrants | Austria | 99.9 /100 | #36 | Exceptional $68,208 |
| Turks | 99.9 /100 | #37 | Exceptional $68,037 |
| Estonians | 99.9 /100 | #38 | Exceptional $67,926 |
| Russians | 99.9 /100 | #39 | Exceptional $67,626 |
| Immigrants | Asia | 99.9 /100 | #40 | Exceptional $67,594 |
| Koreans | 99.9 /100 | #41 | Exceptional $67,472 |
| New Zealanders | 99.9 /100 | #42 | Exceptional $67,333 |
| Latvians | 99.9 /100 | #43 | Exceptional $67,326 |
| Immigrants | South Africa | 99.9 /100 | #44 | Exceptional $67,234 |
| Immigrants | Afghanistan | 99.8 /100 | #45 | Exceptional $67,007 |
| Cambodians | 99.8 /100 | #46 | Exceptional $66,892 |
| Australians | 99.8 /100 | #47 | Exceptional $66,891 |
Demographics Similar to Sub-Saharan Africans by Householder Income Over 65 years
In terms of householder income over 65 years, the demographic groups most similar to Sub-Saharan Africans are Immigrants from Laos ($56,722, a difference of 0.19%), Immigrants from Guyana ($56,495, a difference of 0.21%), Fijian ($56,768, a difference of 0.27%), Yaqui ($56,417, a difference of 0.35%), and Guyanese ($56,351, a difference of 0.47%).
| Demographics | Rating | Rank | Householder Income Over 65 years |
| Immigrants | Western Africa | 1.7 /100 | #233 | Tragic $57,119 |
| Immigrants | Burma/Myanmar | 1.7 /100 | #234 | Tragic $57,114 |
| Spanish Americans | 1.6 /100 | #235 | Tragic $57,021 |
| Immigrants | Uruguay | 1.5 /100 | #236 | Tragic $56,975 |
| Immigrants | Panama | 1.5 /100 | #237 | Tragic $56,944 |
| Fijians | 1.2 /100 | #238 | Tragic $56,768 |
| Immigrants | Laos | 1.2 /100 | #239 | Tragic $56,722 |
| Sub-Saharan Africans | 1.0 /100 | #240 | Tragic $56,615 |
| Immigrants | Guyana | 0.9 /100 | #241 | Tragic $56,495 |
| Yaqui | 0.8 /100 | #242 | Tragic $56,417 |
| Guyanese | 0.8 /100 | #243 | Tragic $56,351 |
| Hmong | 0.8 /100 | #244 | Tragic $56,339 |
| Immigrants | Uzbekistan | 0.8 /100 | #245 | Tragic $56,331 |
| Central Americans | 0.8 /100 | #246 | Tragic $56,321 |
| Yakama | 0.7 /100 | #247 | Tragic $56,234 |