Sioux vs Haitian Householder Income Over 65 years
COMPARE
Sioux
Haitian
Householder Income Over 65 years
Householder Income Over 65 years Comparison
Sioux
Haitians
$52,509
HOUSEHOLDER INCOME OVER 65 YEARS
0.0/ 100
METRIC RATING
310th/ 347
METRIC RANK
$51,912
HOUSEHOLDER INCOME OVER 65 YEARS
0.0/ 100
METRIC RATING
318th/ 347
METRIC RANK
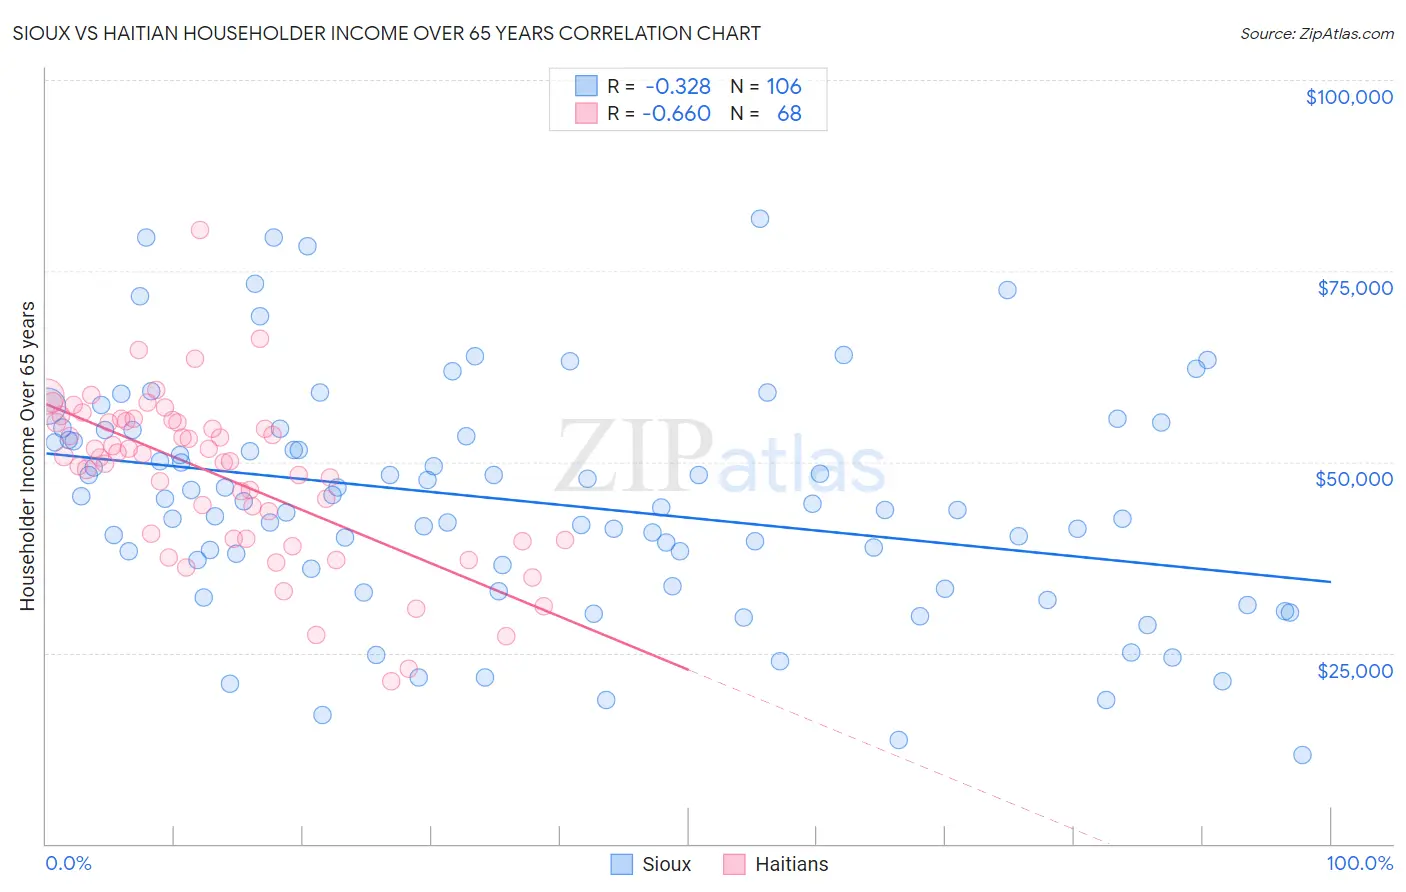
Sioux vs Haitian Householder Income Over 65 years Correlation Chart
The statistical analysis conducted on geographies consisting of 233,494,495 people shows a mild negative correlation between the proportion of Sioux and household income with householder over the age of 65 in the United States with a correlation coefficient (R) of -0.328 and weighted average of $52,509. Similarly, the statistical analysis conducted on geographies consisting of 286,836,120 people shows a significant negative correlation between the proportion of Haitians and household income with householder over the age of 65 in the United States with a correlation coefficient (R) of -0.660 and weighted average of $51,912, a difference of 1.1%.
Householder Income Over 65 years Correlation Summary
| Measurement | Sioux | Haitian |
| Minimum | $11,667 | $21,207 |
| Maximum | $81,875 | $80,361 |
| Range | $70,208 | $59,154 |
| Mean | $44,773 | $48,246 |
| Median | $44,286 | $50,679 |
| Interquartile 25% (IQ1) | $36,021 | $39,901 |
| Interquartile 75% (IQ3) | $53,333 | $55,223 |
| Interquartile Range (IQR) | $17,312 | $15,322 |
| Standard Deviation (Sample) | $14,854 | $10,731 |
| Standard Deviation (Population) | $14,783 | $10,652 |
Demographics Similar to Sioux and Haitians by Householder Income Over 65 years
In terms of householder income over 65 years, the demographic groups most similar to Sioux are Honduran ($52,634, a difference of 0.24%), Seminole ($52,373, a difference of 0.26%), Immigrants from Mexico ($52,801, a difference of 0.56%), Hispanic or Latino ($52,832, a difference of 0.62%), and Pennsylvania German ($52,888, a difference of 0.72%). Similarly, the demographic groups most similar to Haitians are Immigrants from St. Vincent and the Grenadines ($51,922, a difference of 0.020%), Immigrants from Honduras ($51,888, a difference of 0.050%), Creek ($51,949, a difference of 0.070%), U.S. Virgin Islander ($52,072, a difference of 0.31%), and Immigrants from Nicaragua ($52,085, a difference of 0.33%).
| Demographics | Rating | Rank | Householder Income Over 65 years |
| Ute | 0.0 /100 | #304 | Tragic $52,949 |
| Pueblo | 0.0 /100 | #305 | Tragic $52,930 |
| Pennsylvania Germans | 0.0 /100 | #306 | Tragic $52,888 |
| Hispanics or Latinos | 0.0 /100 | #307 | Tragic $52,832 |
| Immigrants | Mexico | 0.0 /100 | #308 | Tragic $52,801 |
| Hondurans | 0.0 /100 | #309 | Tragic $52,634 |
| Sioux | 0.0 /100 | #310 | Tragic $52,509 |
| Seminole | 0.0 /100 | #311 | Tragic $52,373 |
| Immigrants | Azores | 0.0 /100 | #312 | Tragic $52,121 |
| Immigrants | Nicaragua | 0.0 /100 | #313 | Tragic $52,085 |
| Natives/Alaskans | 0.0 /100 | #314 | Tragic $52,081 |
| U.S. Virgin Islanders | 0.0 /100 | #315 | Tragic $52,072 |
| Creek | 0.0 /100 | #316 | Tragic $51,949 |
| Immigrants | St. Vincent and the Grenadines | 0.0 /100 | #317 | Tragic $51,922 |
| Haitians | 0.0 /100 | #318 | Tragic $51,912 |
| Immigrants | Honduras | 0.0 /100 | #319 | Tragic $51,888 |
| Colville | 0.0 /100 | #320 | Tragic $51,739 |
| Menominee | 0.0 /100 | #321 | Tragic $51,719 |
| British West Indians | 0.0 /100 | #322 | Tragic $51,463 |
| Cajuns | 0.0 /100 | #323 | Tragic $51,397 |
| Immigrants | Congo | 0.0 /100 | #324 | Tragic $51,393 |