Bermudan vs Subsaharan African Householder Income Over 65 years
COMPARE
Bermudan
Subsaharan African
Householder Income Over 65 years
Householder Income Over 65 years Comparison
Bermudans
Sub-Saharan Africans
$58,171
HOUSEHOLDER INCOME OVER 65 YEARS
5.1/ 100
METRIC RATING
224th/ 347
METRIC RANK
$56,615
HOUSEHOLDER INCOME OVER 65 YEARS
1.0/ 100
METRIC RATING
240th/ 347
METRIC RANK
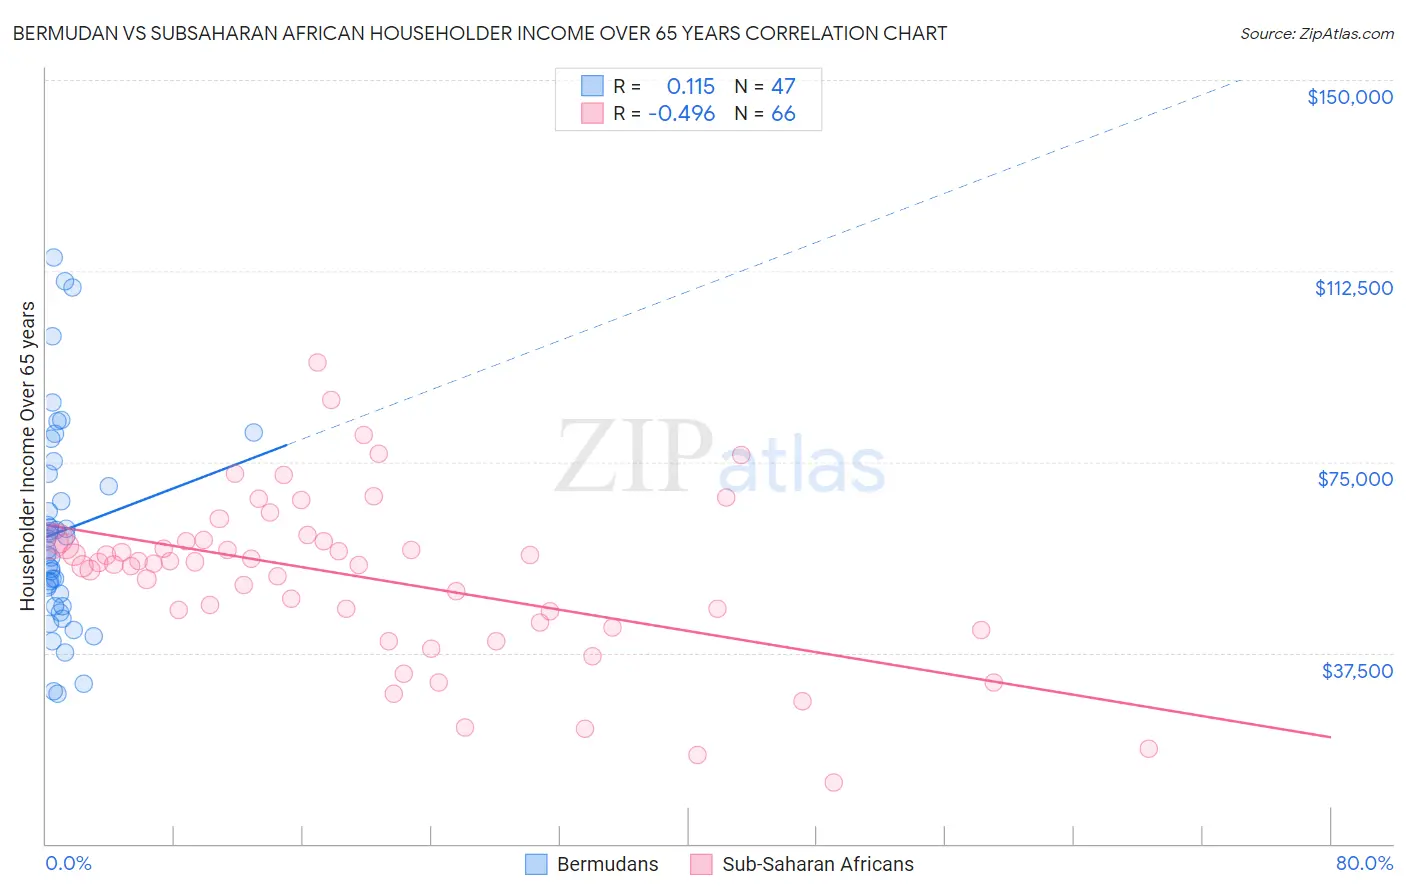
Bermudan vs Subsaharan African Householder Income Over 65 years Correlation Chart
The statistical analysis conducted on geographies consisting of 55,673,391 people shows a poor positive correlation between the proportion of Bermudans and household income with householder over the age of 65 in the United States with a correlation coefficient (R) of 0.115 and weighted average of $58,171. Similarly, the statistical analysis conducted on geographies consisting of 505,008,485 people shows a moderate negative correlation between the proportion of Sub-Saharan Africans and household income with householder over the age of 65 in the United States with a correlation coefficient (R) of -0.496 and weighted average of $56,615, a difference of 2.8%.
Householder Income Over 65 years Correlation Summary
| Measurement | Bermudan | Subsaharan African |
| Minimum | $29,369 | $12,049 |
| Maximum | $115,179 | $94,427 |
| Range | $85,810 | $82,378 |
| Mean | $61,411 | $52,341 |
| Median | $57,809 | $55,146 |
| Interquartile 25% (IQ1) | $46,689 | $43,507 |
| Interquartile 75% (IQ3) | $72,720 | $59,521 |
| Interquartile Range (IQR) | $26,031 | $16,014 |
| Standard Deviation (Sample) | $20,368 | $16,149 |
| Standard Deviation (Population) | $20,150 | $16,026 |
Demographics Similar to Bermudans and Sub-Saharan Africans by Householder Income Over 65 years
In terms of householder income over 65 years, the demographic groups most similar to Bermudans are Tsimshian ($58,202, a difference of 0.050%), Delaware ($58,214, a difference of 0.080%), Venezuelan ($58,026, a difference of 0.25%), French Canadian ($57,975, a difference of 0.34%), and Japanese ($57,919, a difference of 0.43%). Similarly, the demographic groups most similar to Sub-Saharan Africans are Immigrants from Laos ($56,722, a difference of 0.19%), Immigrants from Guyana ($56,495, a difference of 0.21%), Fijian ($56,768, a difference of 0.27%), Yaqui ($56,417, a difference of 0.35%), and Immigrants from Panama ($56,944, a difference of 0.58%).
| Demographics | Rating | Rank | Householder Income Over 65 years |
| Delaware | 5.3 /100 | #222 | Tragic $58,214 |
| Tsimshian | 5.2 /100 | #223 | Tragic $58,202 |
| Bermudans | 5.1 /100 | #224 | Tragic $58,171 |
| Venezuelans | 4.4 /100 | #225 | Tragic $58,026 |
| French Canadians | 4.2 /100 | #226 | Tragic $57,975 |
| Japanese | 3.9 /100 | #227 | Tragic $57,919 |
| Immigrants | Albania | 3.6 /100 | #228 | Tragic $57,828 |
| Immigrants | Colombia | 3.0 /100 | #229 | Tragic $57,658 |
| Immigrants | Cambodia | 2.8 /100 | #230 | Tragic $57,580 |
| Immigrants | Nonimmigrants | 2.4 /100 | #231 | Tragic $57,426 |
| Immigrants | Venezuela | 2.3 /100 | #232 | Tragic $57,371 |
| Immigrants | Western Africa | 1.7 /100 | #233 | Tragic $57,119 |
| Immigrants | Burma/Myanmar | 1.7 /100 | #234 | Tragic $57,114 |
| Spanish Americans | 1.6 /100 | #235 | Tragic $57,021 |
| Immigrants | Uruguay | 1.5 /100 | #236 | Tragic $56,975 |
| Immigrants | Panama | 1.5 /100 | #237 | Tragic $56,944 |
| Fijians | 1.2 /100 | #238 | Tragic $56,768 |
| Immigrants | Laos | 1.2 /100 | #239 | Tragic $56,722 |
| Sub-Saharan Africans | 1.0 /100 | #240 | Tragic $56,615 |
| Immigrants | Guyana | 0.9 /100 | #241 | Tragic $56,495 |
| Yaqui | 0.8 /100 | #242 | Tragic $56,417 |