Sioux vs Native Hawaiian Householder Income Over 65 years
COMPARE
Sioux
Native Hawaiian
Householder Income Over 65 years
Householder Income Over 65 years Comparison
Sioux
Native Hawaiians
$52,509
HOUSEHOLDER INCOME OVER 65 YEARS
0.0/ 100
METRIC RATING
310th/ 347
METRIC RANK
$71,021
HOUSEHOLDER INCOME OVER 65 YEARS
100.0/ 100
METRIC RATING
15th/ 347
METRIC RANK
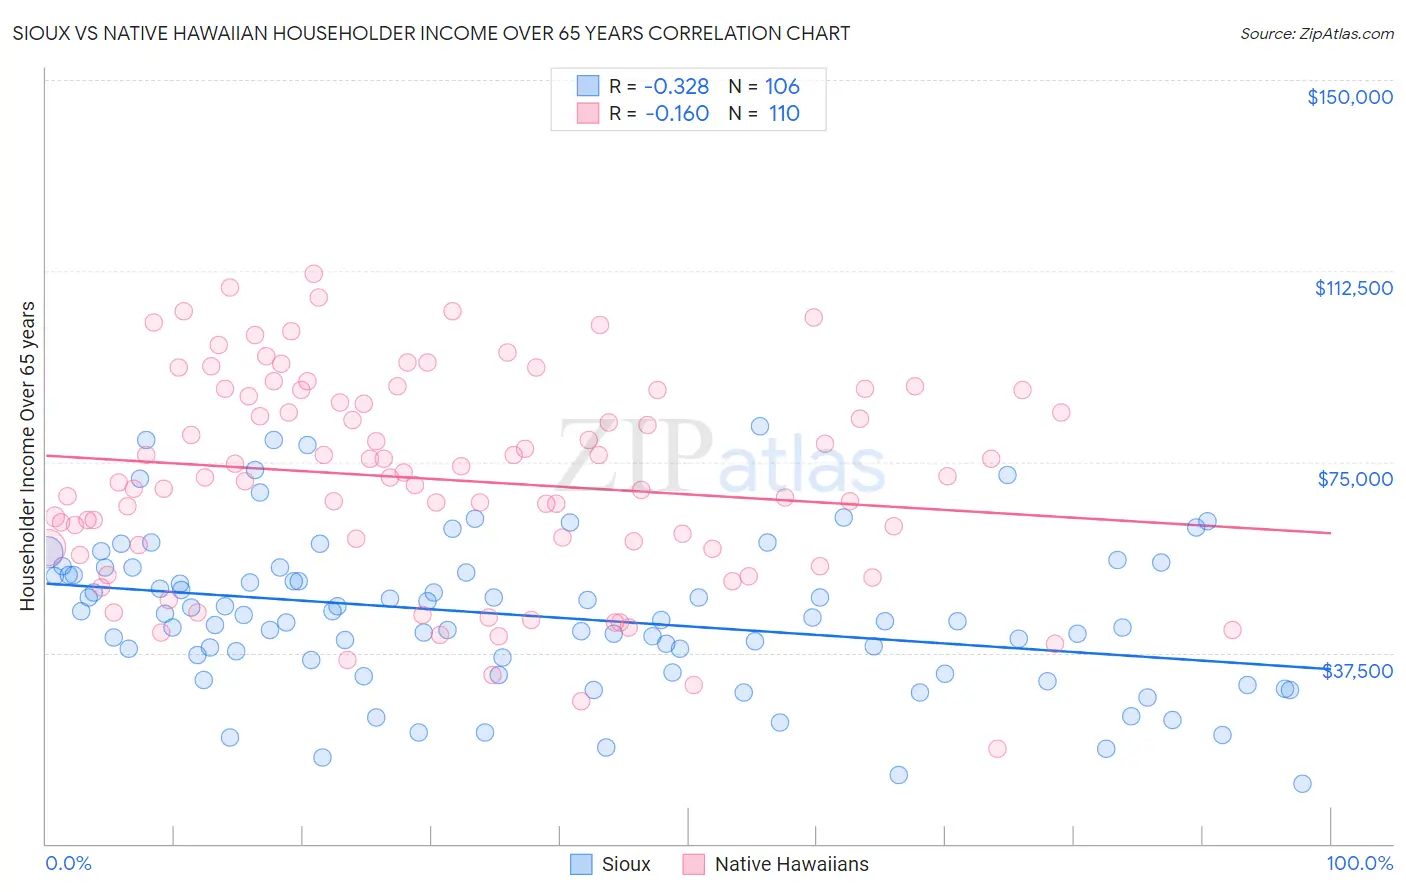
Sioux vs Native Hawaiian Householder Income Over 65 years Correlation Chart
The statistical analysis conducted on geographies consisting of 233,494,495 people shows a mild negative correlation between the proportion of Sioux and household income with householder over the age of 65 in the United States with a correlation coefficient (R) of -0.328 and weighted average of $52,509. Similarly, the statistical analysis conducted on geographies consisting of 330,764,253 people shows a poor negative correlation between the proportion of Native Hawaiians and household income with householder over the age of 65 in the United States with a correlation coefficient (R) of -0.160 and weighted average of $71,021, a difference of 35.3%.
Householder Income Over 65 years Correlation Summary
| Measurement | Sioux | Native Hawaiian |
| Minimum | $11,667 | $18,720 |
| Maximum | $81,875 | $112,011 |
| Range | $70,208 | $93,291 |
| Mean | $44,773 | $71,470 |
| Median | $44,286 | $71,949 |
| Interquartile 25% (IQ1) | $36,021 | $58,178 |
| Interquartile 75% (IQ3) | $53,333 | $88,994 |
| Interquartile Range (IQR) | $17,312 | $30,816 |
| Standard Deviation (Sample) | $14,854 | $20,453 |
| Standard Deviation (Population) | $14,783 | $20,359 |
Similar Demographics by Householder Income Over 65 years
Demographics Similar to Sioux by Householder Income Over 65 years
In terms of householder income over 65 years, the demographic groups most similar to Sioux are Honduran ($52,634, a difference of 0.24%), Seminole ($52,373, a difference of 0.26%), Immigrants from Mexico ($52,801, a difference of 0.56%), Hispanic or Latino ($52,832, a difference of 0.62%), and Pennsylvania German ($52,888, a difference of 0.72%).
| Demographics | Rating | Rank | Householder Income Over 65 years |
| Choctaw | 0.0 /100 | #303 | Tragic $53,060 |
| Ute | 0.0 /100 | #304 | Tragic $52,949 |
| Pueblo | 0.0 /100 | #305 | Tragic $52,930 |
| Pennsylvania Germans | 0.0 /100 | #306 | Tragic $52,888 |
| Hispanics or Latinos | 0.0 /100 | #307 | Tragic $52,832 |
| Immigrants | Mexico | 0.0 /100 | #308 | Tragic $52,801 |
| Hondurans | 0.0 /100 | #309 | Tragic $52,634 |
| Sioux | 0.0 /100 | #310 | Tragic $52,509 |
| Seminole | 0.0 /100 | #311 | Tragic $52,373 |
| Immigrants | Azores | 0.0 /100 | #312 | Tragic $52,121 |
| Immigrants | Nicaragua | 0.0 /100 | #313 | Tragic $52,085 |
| Natives/Alaskans | 0.0 /100 | #314 | Tragic $52,081 |
| U.S. Virgin Islanders | 0.0 /100 | #315 | Tragic $52,072 |
| Creek | 0.0 /100 | #316 | Tragic $51,949 |
| Immigrants | St. Vincent and the Grenadines | 0.0 /100 | #317 | Tragic $51,922 |
Demographics Similar to Native Hawaiians by Householder Income Over 65 years
In terms of householder income over 65 years, the demographic groups most similar to Native Hawaiians are Burmese ($71,139, a difference of 0.17%), Okinawan ($70,846, a difference of 0.25%), Immigrants from Korea ($70,696, a difference of 0.46%), Immigrants from Hong Kong ($71,567, a difference of 0.77%), and Eastern European ($70,470, a difference of 0.78%).
| Demographics | Rating | Rank | Householder Income Over 65 years |
| Immigrants | Singapore | 100.0 /100 | #8 | Exceptional $72,963 |
| Immigrants | India | 100.0 /100 | #9 | Exceptional $72,804 |
| Bhutanese | 100.0 /100 | #10 | Exceptional $72,288 |
| Thais | 100.0 /100 | #11 | Exceptional $72,099 |
| Cypriots | 100.0 /100 | #12 | Exceptional $71,714 |
| Immigrants | Hong Kong | 100.0 /100 | #13 | Exceptional $71,567 |
| Burmese | 100.0 /100 | #14 | Exceptional $71,139 |
| Native Hawaiians | 100.0 /100 | #15 | Exceptional $71,021 |
| Okinawans | 100.0 /100 | #16 | Exceptional $70,846 |
| Immigrants | Korea | 100.0 /100 | #17 | Exceptional $70,696 |
| Eastern Europeans | 100.0 /100 | #18 | Exceptional $70,470 |
| Indians (Asian) | 100.0 /100 | #19 | Exceptional $70,238 |
| Immigrants | South Central Asia | 100.0 /100 | #20 | Exceptional $70,103 |
| Immigrants | Eastern Asia | 100.0 /100 | #21 | Exceptional $69,872 |
| Immigrants | Israel | 100.0 /100 | #22 | Exceptional $69,857 |