Indian (Asian) vs Haitian Householder Income Over 65 years
COMPARE
Indian (Asian)
Haitian
Householder Income Over 65 years
Householder Income Over 65 years Comparison
Indians (Asian)
Haitians
$70,238
HOUSEHOLDER INCOME OVER 65 YEARS
100.0/ 100
METRIC RATING
19th/ 347
METRIC RANK
$51,912
HOUSEHOLDER INCOME OVER 65 YEARS
0.0/ 100
METRIC RATING
318th/ 347
METRIC RANK
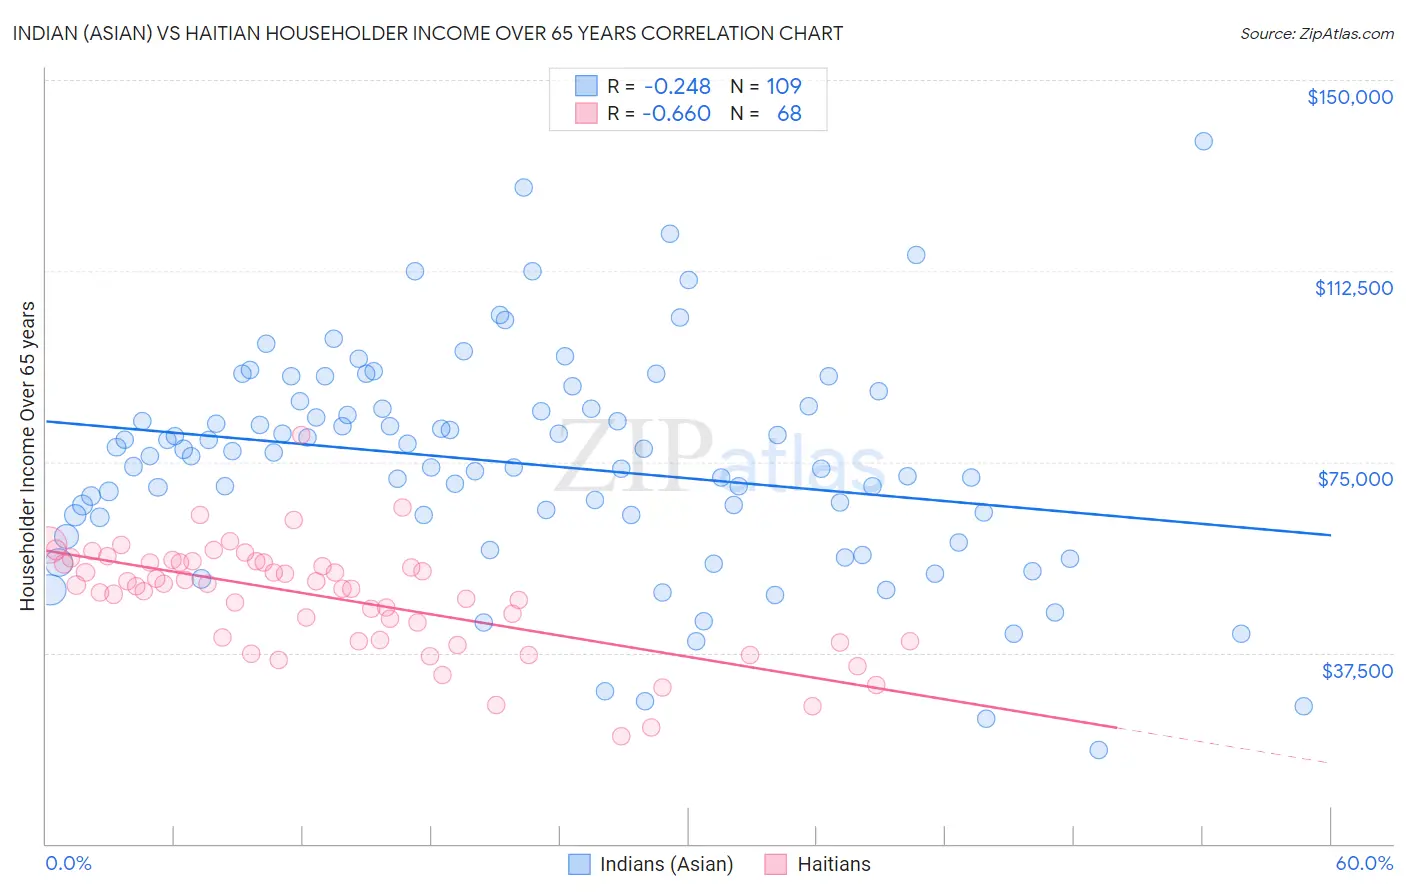
Indian (Asian) vs Haitian Householder Income Over 65 years Correlation Chart
The statistical analysis conducted on geographies consisting of 492,472,602 people shows a weak negative correlation between the proportion of Indians (Asian) and household income with householder over the age of 65 in the United States with a correlation coefficient (R) of -0.248 and weighted average of $70,238. Similarly, the statistical analysis conducted on geographies consisting of 286,836,120 people shows a significant negative correlation between the proportion of Haitians and household income with householder over the age of 65 in the United States with a correlation coefficient (R) of -0.660 and weighted average of $51,912, a difference of 35.3%.
Householder Income Over 65 years Correlation Summary
| Measurement | Indian (Asian) | Haitian |
| Minimum | $18,324 | $21,207 |
| Maximum | $137,919 | $80,361 |
| Range | $119,595 | $59,154 |
| Mean | $74,584 | $48,246 |
| Median | $76,155 | $50,679 |
| Interquartile 25% (IQ1) | $64,279 | $39,901 |
| Interquartile 75% (IQ3) | $85,582 | $55,223 |
| Interquartile Range (IQR) | $21,303 | $15,322 |
| Standard Deviation (Sample) | $21,534 | $10,731 |
| Standard Deviation (Population) | $21,435 | $10,652 |
Similar Demographics by Householder Income Over 65 years
Demographics Similar to Indians (Asian) by Householder Income Over 65 years
In terms of householder income over 65 years, the demographic groups most similar to Indians (Asian) are Immigrants from South Central Asia ($70,103, a difference of 0.19%), Eastern European ($70,470, a difference of 0.33%), Immigrants from Eastern Asia ($69,872, a difference of 0.52%), Immigrants from Israel ($69,857, a difference of 0.55%), and Immigrants from Korea ($70,696, a difference of 0.65%).
| Demographics | Rating | Rank | Householder Income Over 65 years |
| Cypriots | 100.0 /100 | #12 | Exceptional $71,714 |
| Immigrants | Hong Kong | 100.0 /100 | #13 | Exceptional $71,567 |
| Burmese | 100.0 /100 | #14 | Exceptional $71,139 |
| Native Hawaiians | 100.0 /100 | #15 | Exceptional $71,021 |
| Okinawans | 100.0 /100 | #16 | Exceptional $70,846 |
| Immigrants | Korea | 100.0 /100 | #17 | Exceptional $70,696 |
| Eastern Europeans | 100.0 /100 | #18 | Exceptional $70,470 |
| Indians (Asian) | 100.0 /100 | #19 | Exceptional $70,238 |
| Immigrants | South Central Asia | 100.0 /100 | #20 | Exceptional $70,103 |
| Immigrants | Eastern Asia | 100.0 /100 | #21 | Exceptional $69,872 |
| Immigrants | Israel | 100.0 /100 | #22 | Exceptional $69,857 |
| Immigrants | Japan | 100.0 /100 | #23 | Exceptional $69,774 |
| Immigrants | Sweden | 100.0 /100 | #24 | Exceptional $69,722 |
| Immigrants | Belgium | 100.0 /100 | #25 | Exceptional $69,703 |
| Immigrants | Sri Lanka | 100.0 /100 | #26 | Exceptional $69,426 |
Demographics Similar to Haitians by Householder Income Over 65 years
In terms of householder income over 65 years, the demographic groups most similar to Haitians are Immigrants from St. Vincent and the Grenadines ($51,922, a difference of 0.020%), Immigrants from Honduras ($51,888, a difference of 0.050%), Creek ($51,949, a difference of 0.070%), U.S. Virgin Islander ($52,072, a difference of 0.31%), and Immigrants from Nicaragua ($52,085, a difference of 0.33%).
| Demographics | Rating | Rank | Householder Income Over 65 years |
| Seminole | 0.0 /100 | #311 | Tragic $52,373 |
| Immigrants | Azores | 0.0 /100 | #312 | Tragic $52,121 |
| Immigrants | Nicaragua | 0.0 /100 | #313 | Tragic $52,085 |
| Natives/Alaskans | 0.0 /100 | #314 | Tragic $52,081 |
| U.S. Virgin Islanders | 0.0 /100 | #315 | Tragic $52,072 |
| Creek | 0.0 /100 | #316 | Tragic $51,949 |
| Immigrants | St. Vincent and the Grenadines | 0.0 /100 | #317 | Tragic $51,922 |
| Haitians | 0.0 /100 | #318 | Tragic $51,912 |
| Immigrants | Honduras | 0.0 /100 | #319 | Tragic $51,888 |
| Colville | 0.0 /100 | #320 | Tragic $51,739 |
| Menominee | 0.0 /100 | #321 | Tragic $51,719 |
| British West Indians | 0.0 /100 | #322 | Tragic $51,463 |
| Cajuns | 0.0 /100 | #323 | Tragic $51,397 |
| Immigrants | Congo | 0.0 /100 | #324 | Tragic $51,393 |
| Immigrants | Haiti | 0.0 /100 | #325 | Tragic $51,219 |