Sioux vs Houma Householder Income Under 25 years
COMPARE
Sioux
Houma
Householder Income Under 25 years
Householder Income Under 25 years Comparison
Sioux
Houma
$46,417
HOUSEHOLDER INCOME UNDER 25 YEARS
0.0/ 100
METRIC RATING
322nd/ 347
METRIC RANK
$44,356
HOUSEHOLDER INCOME UNDER 25 YEARS
0.0/ 100
METRIC RATING
341st/ 347
METRIC RANK
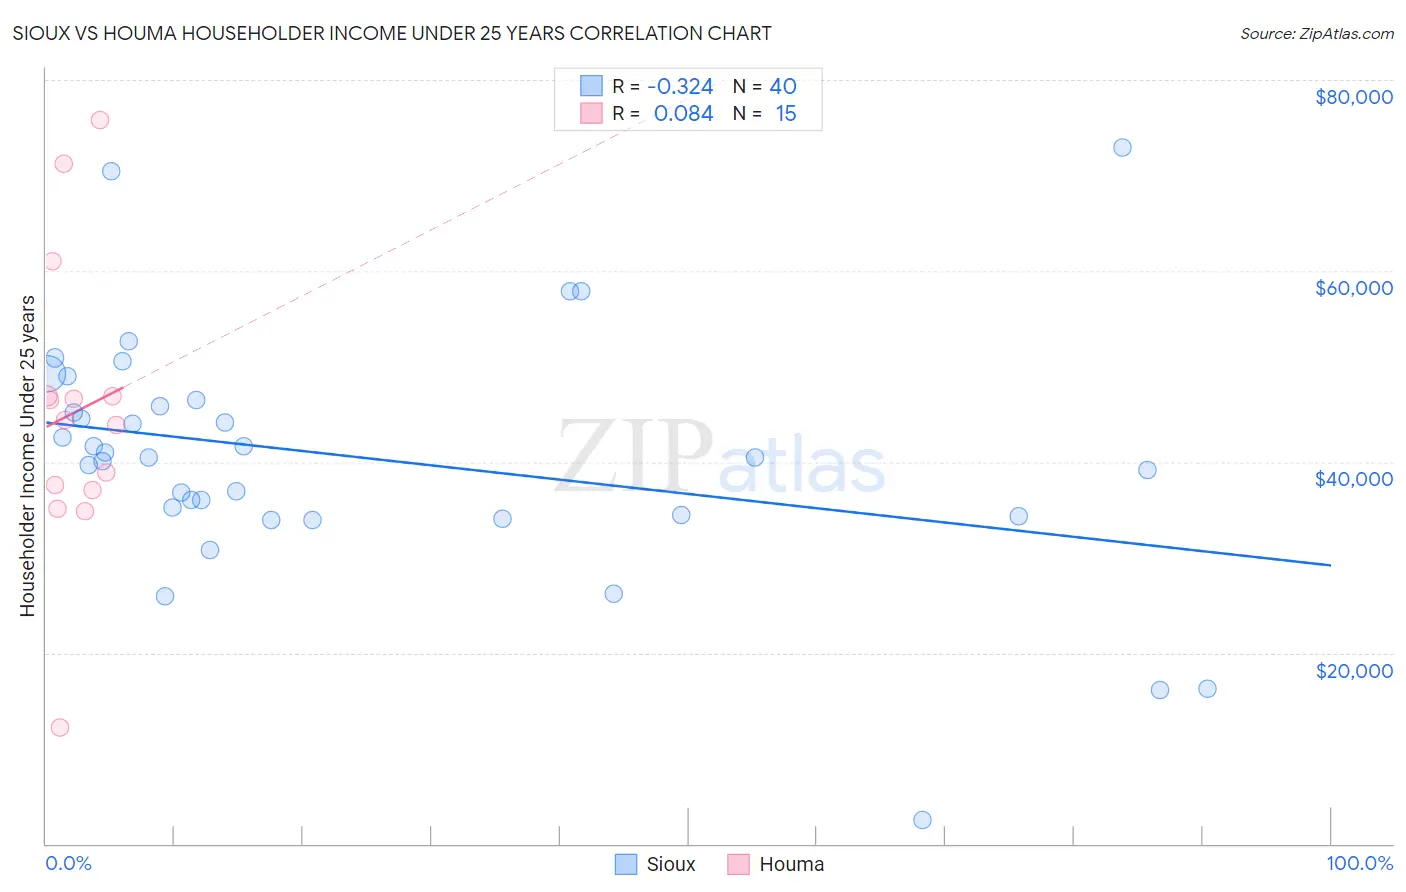
Sioux vs Houma Householder Income Under 25 years Correlation Chart
The statistical analysis conducted on geographies consisting of 212,065,769 people shows a mild negative correlation between the proportion of Sioux and household income with householder under the age of 25 in the United States with a correlation coefficient (R) of -0.324 and weighted average of $46,417. Similarly, the statistical analysis conducted on geographies consisting of 35,697,476 people shows a slight positive correlation between the proportion of Houma and household income with householder under the age of 25 in the United States with a correlation coefficient (R) of 0.084 and weighted average of $44,356, a difference of 4.6%.
Householder Income Under 25 years Correlation Summary
| Measurement | Sioux | Houma |
| Minimum | $2,499 | $12,212 |
| Maximum | $72,963 | $75,747 |
| Range | $70,464 | $63,535 |
| Mean | $40,443 | $45,249 |
| Median | $40,443 | $44,434 |
| Interquartile 25% (IQ1) | $34,375 | $37,081 |
| Interquartile 75% (IQ3) | $46,105 | $46,891 |
| Interquartile Range (IQR) | $11,730 | $9,810 |
| Standard Deviation (Sample) | $13,035 | $15,434 |
| Standard Deviation (Population) | $12,871 | $14,910 |
Demographics Similar to Sioux and Houma by Householder Income Under 25 years
In terms of householder income under 25 years, the demographic groups most similar to Sioux are Potawatomi ($46,462, a difference of 0.10%), Immigrants from Saudi Arabia ($46,187, a difference of 0.50%), Dutch West Indian ($45,816, a difference of 1.3%), Immigrants from Bahamas ($45,793, a difference of 1.4%), and Osage ($45,764, a difference of 1.4%). Similarly, the demographic groups most similar to Houma are Black/African American ($44,381, a difference of 0.060%), Kiowa ($44,733, a difference of 0.85%), Chickasaw ($44,763, a difference of 0.92%), Pueblo ($45,018, a difference of 1.5%), and Tohono O'odham ($45,248, a difference of 2.0%).
| Demographics | Rating | Rank | Householder Income Under 25 years |
| Potawatomi | 0.0 /100 | #321 | Tragic $46,462 |
| Sioux | 0.0 /100 | #322 | Tragic $46,417 |
| Immigrants | Saudi Arabia | 0.0 /100 | #323 | Tragic $46,187 |
| Dutch West Indians | 0.0 /100 | #324 | Tragic $45,816 |
| Immigrants | Bahamas | 0.0 /100 | #325 | Tragic $45,793 |
| Osage | 0.0 /100 | #326 | Tragic $45,764 |
| Bahamians | 0.0 /100 | #327 | Tragic $45,743 |
| German Russians | 0.0 /100 | #328 | Tragic $45,673 |
| Seminole | 0.0 /100 | #329 | Tragic $45,649 |
| Indonesians | 0.0 /100 | #330 | Tragic $45,566 |
| Immigrants | Zaire | 0.0 /100 | #331 | Tragic $45,529 |
| Choctaw | 0.0 /100 | #332 | Tragic $45,450 |
| Creek | 0.0 /100 | #333 | Tragic $45,371 |
| Cajuns | 0.0 /100 | #334 | Tragic $45,338 |
| Cheyenne | 0.0 /100 | #335 | Tragic $45,275 |
| Tohono O'odham | 0.0 /100 | #336 | Tragic $45,248 |
| Pueblo | 0.0 /100 | #337 | Tragic $45,018 |
| Chickasaw | 0.0 /100 | #338 | Tragic $44,763 |
| Kiowa | 0.0 /100 | #339 | Tragic $44,733 |
| Blacks/African Americans | 0.0 /100 | #340 | Tragic $44,381 |
| Houma | 0.0 /100 | #341 | Tragic $44,356 |