Shoshone vs New Zealander In Labor Force | Age 30-34
COMPARE
Shoshone
New Zealander
In Labor Force | Age 30-34
In Labor Force | Age 30-34 Comparison
Shoshone
New Zealanders
81.4%
IN LABOR FORCE | AGE 30-34
0.0/ 100
METRIC RATING
319th/ 347
METRIC RANK
85.0%
IN LABOR FORCE | AGE 30-34
89.5/ 100
METRIC RATING
133rd/ 347
METRIC RANK
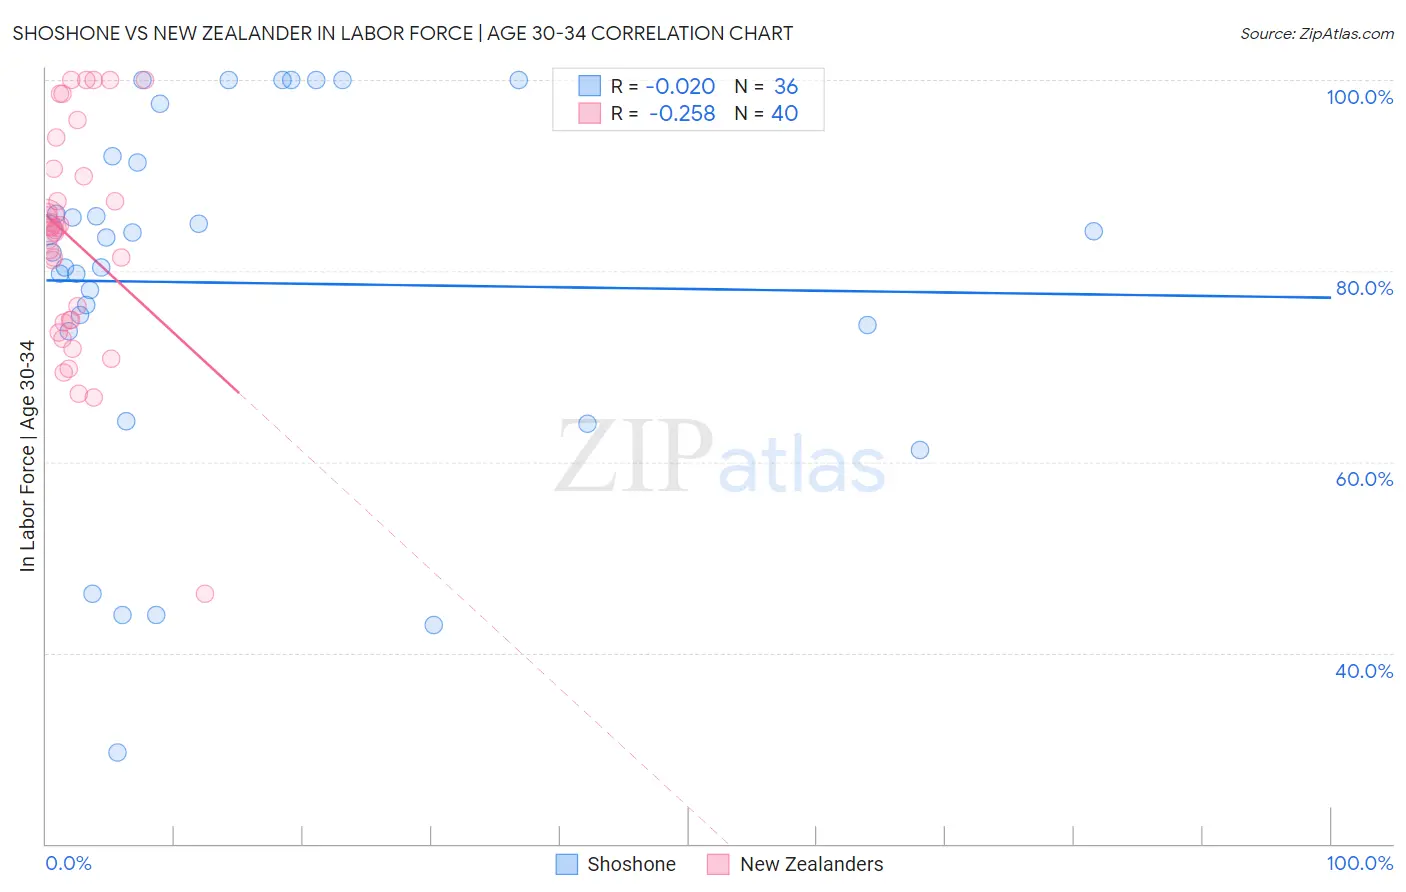
Shoshone vs New Zealander In Labor Force | Age 30-34 Correlation Chart
The statistical analysis conducted on geographies consisting of 66,620,826 people shows no correlation between the proportion of Shoshone and labor force participation rate among population between the ages 30 and 34 in the United States with a correlation coefficient (R) of -0.020 and weighted average of 81.4%. Similarly, the statistical analysis conducted on geographies consisting of 106,910,408 people shows a weak negative correlation between the proportion of New Zealanders and labor force participation rate among population between the ages 30 and 34 in the United States with a correlation coefficient (R) of -0.258 and weighted average of 85.0%, a difference of 4.4%.
In Labor Force | Age 30-34 Correlation Summary
| Measurement | Shoshone | New Zealander |
| Minimum | 29.5% | 46.2% |
| Maximum | 100.0% | 100.0% |
| Range | 70.5% | 53.8% |
| Mean | 78.8% | 83.1% |
| Median | 82.7% | 84.4% |
| Interquartile 25% (IQ1) | 74.0% | 74.7% |
| Interquartile 75% (IQ3) | 91.7% | 90.3% |
| Interquartile Range (IQR) | 17.7% | 15.6% |
| Standard Deviation (Sample) | 18.6% | 11.7% |
| Standard Deviation (Population) | 18.4% | 11.6% |
Similar Demographics by In Labor Force | Age 30-34
Demographics Similar to Shoshone by In Labor Force | Age 30-34
In terms of in labor force | age 30-34, the demographic groups most similar to Shoshone are Choctaw (81.4%, a difference of 0.0%), Yaqui (81.4%, a difference of 0.020%), Arapaho (81.5%, a difference of 0.080%), Immigrants from the Azores (81.5%, a difference of 0.090%), and Alaska Native (81.3%, a difference of 0.10%).
| Demographics | Rating | Rank | In Labor Force | Age 30-34 |
| Mexicans | 0.0 /100 | #312 | Tragic 81.9% |
| Iroquois | 0.0 /100 | #313 | Tragic 81.9% |
| Alaskan Athabascans | 0.0 /100 | #314 | Tragic 81.7% |
| Cherokee | 0.0 /100 | #315 | Tragic 81.6% |
| Immigrants | Azores | 0.0 /100 | #316 | Tragic 81.5% |
| Arapaho | 0.0 /100 | #317 | Tragic 81.5% |
| Choctaw | 0.0 /100 | #318 | Tragic 81.4% |
| Shoshone | 0.0 /100 | #319 | Tragic 81.4% |
| Yaqui | 0.0 /100 | #320 | Tragic 81.4% |
| Alaska Natives | 0.0 /100 | #321 | Tragic 81.3% |
| Puerto Ricans | 0.0 /100 | #322 | Tragic 81.2% |
| Paiute | 0.0 /100 | #323 | Tragic 81.2% |
| Cheyenne | 0.0 /100 | #324 | Tragic 81.1% |
| Dutch West Indians | 0.0 /100 | #325 | Tragic 81.0% |
| Seminole | 0.0 /100 | #326 | Tragic 80.8% |
Demographics Similar to New Zealanders by In Labor Force | Age 30-34
In terms of in labor force | age 30-34, the demographic groups most similar to New Zealanders are Chinese (85.0%, a difference of 0.0%), Immigrants from Israel (85.0%, a difference of 0.0%), Immigrants from Western Africa (85.0%, a difference of 0.010%), Immigrants from Spain (85.0%, a difference of 0.010%), and Immigrants from Chile (85.0%, a difference of 0.010%).
| Demographics | Rating | Rank | In Labor Force | Age 30-34 |
| Austrians | 90.9 /100 | #126 | Exceptional 85.0% |
| Slavs | 90.7 /100 | #127 | Exceptional 85.0% |
| Immigrants | Argentina | 90.6 /100 | #128 | Exceptional 85.0% |
| Immigrants | Western Africa | 90.2 /100 | #129 | Exceptional 85.0% |
| Immigrants | Spain | 90.0 /100 | #130 | Exceptional 85.0% |
| Chinese | 89.6 /100 | #131 | Excellent 85.0% |
| Immigrants | Israel | 89.5 /100 | #132 | Excellent 85.0% |
| New Zealanders | 89.5 /100 | #133 | Excellent 85.0% |
| Immigrants | Chile | 89.2 /100 | #134 | Excellent 85.0% |
| Immigrants | Asia | 88.9 /100 | #135 | Excellent 85.0% |
| Jordanians | 88.6 /100 | #136 | Excellent 85.0% |
| South Africans | 88.0 /100 | #137 | Excellent 85.0% |
| Sri Lankans | 87.8 /100 | #138 | Excellent 85.0% |
| Bhutanese | 87.5 /100 | #139 | Excellent 85.0% |
| Immigrants | Vietnam | 86.5 /100 | #140 | Excellent 85.0% |