Armenian vs Iranian Median Household Income
COMPARE
Armenian
Iranian
Median Household Income
Median Household Income Comparison
Armenians
Iranians
$91,807
MEDIAN HOUSEHOLD INCOME
98.7/ 100
METRIC RATING
95th/ 347
METRIC RANK
$109,835
MEDIAN HOUSEHOLD INCOME
100.0/ 100
METRIC RATING
7th/ 347
METRIC RANK
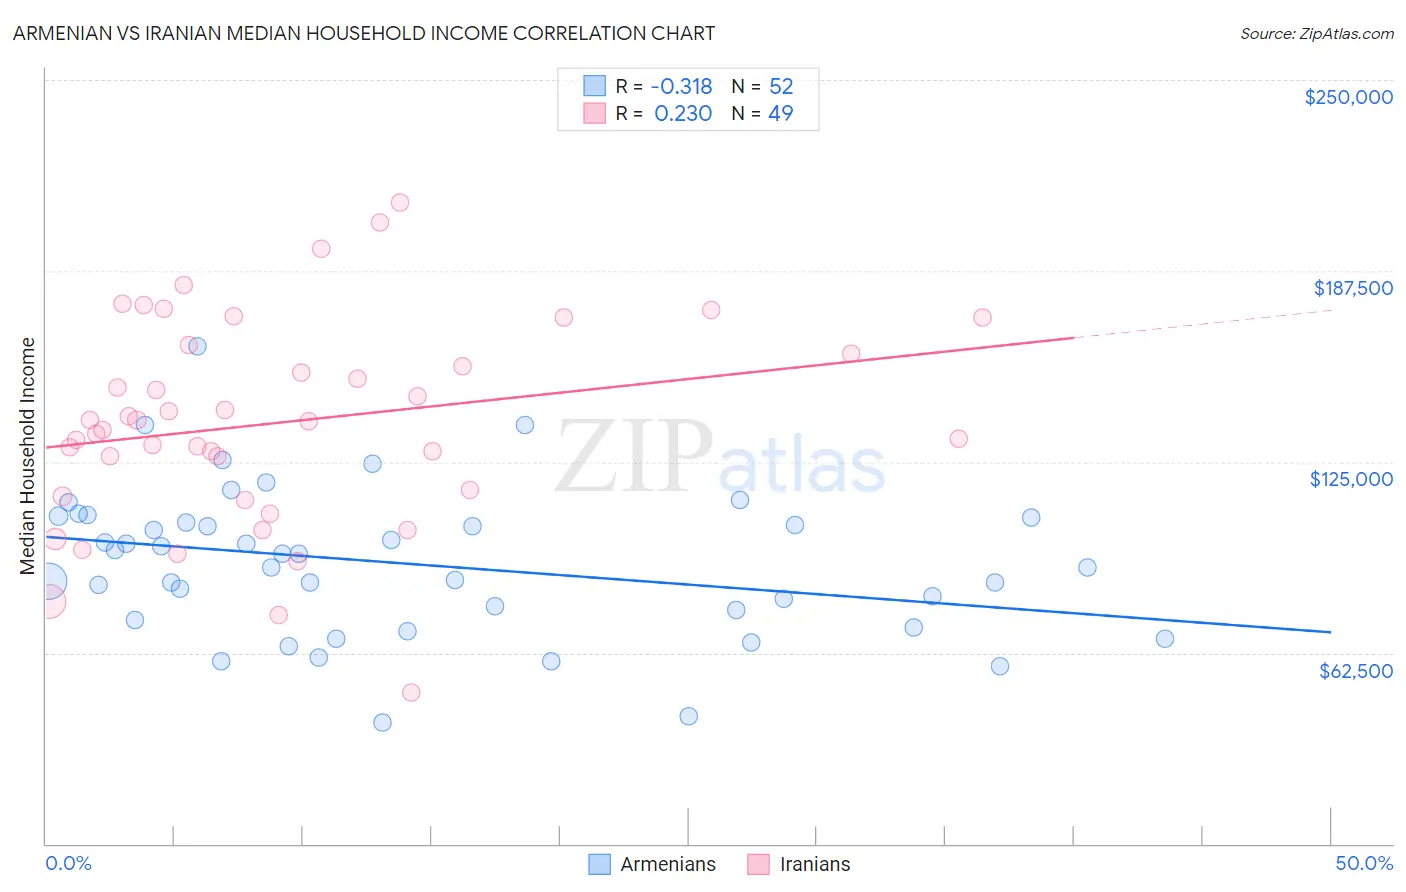
Armenian vs Iranian Median Household Income Correlation Chart
The statistical analysis conducted on geographies consisting of 310,713,421 people shows a mild negative correlation between the proportion of Armenians and median household income in the United States with a correlation coefficient (R) of -0.318 and weighted average of $91,807. Similarly, the statistical analysis conducted on geographies consisting of 316,594,709 people shows a weak positive correlation between the proportion of Iranians and median household income in the United States with a correlation coefficient (R) of 0.230 and weighted average of $109,835, a difference of 19.6%.
Median Household Income Correlation Summary
| Measurement | Armenian | Iranian |
| Minimum | $39,713 | $49,583 |
| Maximum | $162,732 | $210,000 |
| Range | $123,019 | $160,417 |
| Mean | $91,613 | $137,928 |
| Median | $92,502 | $138,452 |
| Interquartile 25% (IQ1) | $74,815 | $114,688 |
| Interquartile 75% (IQ3) | $106,031 | $161,748 |
| Interquartile Range (IQR) | $31,215 | $47,060 |
| Standard Deviation (Sample) | $24,104 | $33,663 |
| Standard Deviation (Population) | $23,871 | $33,318 |
Similar Demographics by Median Household Income
Demographics Similar to Armenians by Median Household Income
In terms of median household income, the demographic groups most similar to Armenians are Jordanian ($91,794, a difference of 0.010%), Immigrants from North America ($91,860, a difference of 0.060%), Immigrants from Serbia ($91,730, a difference of 0.080%), Immigrants from Lebanon ($91,887, a difference of 0.090%), and Immigrants from Western Europe ($91,936, a difference of 0.14%).
| Demographics | Rating | Rank | Median Household Income |
| Immigrants | Canada | 98.8 /100 | #88 | Exceptional $92,029 |
| Romanians | 98.8 /100 | #89 | Exceptional $91,994 |
| Assyrians/Chaldeans/Syriacs | 98.8 /100 | #90 | Exceptional $91,991 |
| Immigrants | Vietnam | 98.8 /100 | #91 | Exceptional $91,987 |
| Immigrants | Western Europe | 98.8 /100 | #92 | Exceptional $91,936 |
| Immigrants | Lebanon | 98.7 /100 | #93 | Exceptional $91,887 |
| Immigrants | North America | 98.7 /100 | #94 | Exceptional $91,860 |
| Armenians | 98.7 /100 | #95 | Exceptional $91,807 |
| Jordanians | 98.7 /100 | #96 | Exceptional $91,794 |
| Immigrants | Serbia | 98.6 /100 | #97 | Exceptional $91,730 |
| Immigrants | Southern Europe | 98.5 /100 | #98 | Exceptional $91,605 |
| Immigrants | South Eastern Asia | 98.4 /100 | #99 | Exceptional $91,541 |
| Ukrainians | 98.3 /100 | #100 | Exceptional $91,456 |
| Immigrants | Moldova | 98.3 /100 | #101 | Exceptional $91,446 |
| Austrians | 98.2 /100 | #102 | Exceptional $91,339 |
Demographics Similar to Iranians by Median Household Income
In terms of median household income, the demographic groups most similar to Iranians are Immigrants from Singapore ($110,428, a difference of 0.54%), Thai ($110,648, a difference of 0.74%), Immigrants from Hong Kong ($111,519, a difference of 1.5%), Immigrants from Iran ($108,055, a difference of 1.7%), and Immigrants from India ($113,009, a difference of 2.9%).
| Demographics | Rating | Rank | Median Household Income |
| Immigrants | Taiwan | 100.0 /100 | #1 | Exceptional $116,460 |
| Filipinos | 100.0 /100 | #2 | Exceptional $115,509 |
| Immigrants | India | 100.0 /100 | #3 | Exceptional $113,009 |
| Immigrants | Hong Kong | 100.0 /100 | #4 | Exceptional $111,519 |
| Thais | 100.0 /100 | #5 | Exceptional $110,648 |
| Immigrants | Singapore | 100.0 /100 | #6 | Exceptional $110,428 |
| Iranians | 100.0 /100 | #7 | Exceptional $109,835 |
| Immigrants | Iran | 100.0 /100 | #8 | Exceptional $108,055 |
| Okinawans | 100.0 /100 | #9 | Exceptional $106,624 |
| Immigrants | South Central Asia | 100.0 /100 | #10 | Exceptional $106,057 |
| Immigrants | China | 100.0 /100 | #11 | Exceptional $105,335 |
| Indians (Asian) | 100.0 /100 | #12 | Exceptional $105,262 |
| Immigrants | Eastern Asia | 100.0 /100 | #13 | Exceptional $104,796 |
| Immigrants | Ireland | 100.0 /100 | #14 | Exceptional $104,692 |
| Immigrants | Israel | 100.0 /100 | #15 | Exceptional $104,090 |