Swedish vs Immigrants from Africa Median Family Income
COMPARE
Swedish
Immigrants from Africa
Median Family Income
Median Family Income Comparison
Swedes
Immigrants from Africa
$108,499
MEDIAN FAMILY INCOME
95.1/ 100
METRIC RATING
115th/ 347
METRIC RANK
$100,256
MEDIAN FAMILY INCOME
22.5/ 100
METRIC RATING
198th/ 347
METRIC RANK
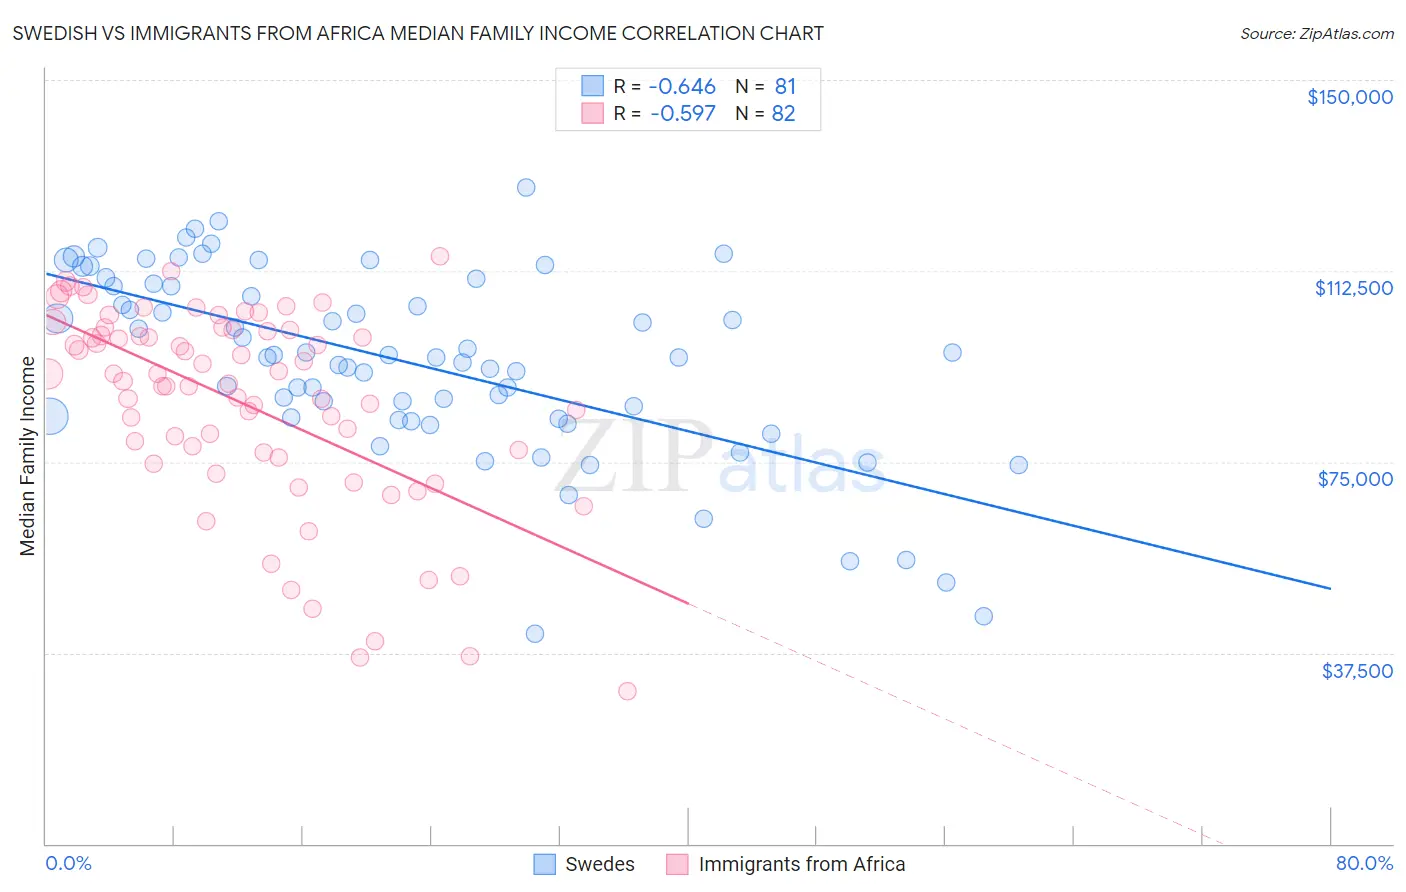
Swedish vs Immigrants from Africa Median Family Income Correlation Chart
The statistical analysis conducted on geographies consisting of 538,326,829 people shows a significant negative correlation between the proportion of Swedes and median family income in the United States with a correlation coefficient (R) of -0.646 and weighted average of $108,499. Similarly, the statistical analysis conducted on geographies consisting of 468,709,431 people shows a substantial negative correlation between the proportion of Immigrants from Africa and median family income in the United States with a correlation coefficient (R) of -0.597 and weighted average of $100,256, a difference of 8.2%.
Median Family Income Correlation Summary
| Measurement | Swedish | Immigrants from Africa |
| Minimum | $41,250 | $29,978 |
| Maximum | $128,899 | $115,502 |
| Range | $87,649 | $85,524 |
| Mean | $94,659 | $86,633 |
| Median | $95,565 | $91,514 |
| Interquartile 25% (IQ1) | $83,510 | $76,824 |
| Interquartile 75% (IQ3) | $109,800 | $100,972 |
| Interquartile Range (IQR) | $26,290 | $24,148 |
| Standard Deviation (Sample) | $18,382 | $19,648 |
| Standard Deviation (Population) | $18,268 | $19,528 |
Similar Demographics by Median Family Income
Demographics Similar to Swedes by Median Family Income
In terms of median family income, the demographic groups most similar to Swedes are Polish ($108,507, a difference of 0.010%), Immigrants from Saudi Arabia ($108,544, a difference of 0.040%), Chilean ($108,429, a difference of 0.060%), Immigrants from Poland ($108,570, a difference of 0.070%), and Immigrants from Western Asia ($108,691, a difference of 0.18%).
| Demographics | Rating | Rank | Median Family Income |
| Immigrants | Zimbabwe | 95.9 /100 | #108 | Exceptional $108,830 |
| Immigrants | Afghanistan | 95.6 /100 | #109 | Exceptional $108,709 |
| British | 95.6 /100 | #110 | Exceptional $108,705 |
| Immigrants | Western Asia | 95.6 /100 | #111 | Exceptional $108,691 |
| Immigrants | Poland | 95.3 /100 | #112 | Exceptional $108,570 |
| Immigrants | Saudi Arabia | 95.2 /100 | #113 | Exceptional $108,544 |
| Poles | 95.2 /100 | #114 | Exceptional $108,507 |
| Swedes | 95.1 /100 | #115 | Exceptional $108,499 |
| Chileans | 95.0 /100 | #116 | Exceptional $108,429 |
| Immigrants | Philippines | 94.6 /100 | #117 | Exceptional $108,288 |
| Ethiopians | 94.5 /100 | #118 | Exceptional $108,251 |
| Sri Lankans | 94.5 /100 | #119 | Exceptional $108,234 |
| Immigrants | Northern Africa | 94.3 /100 | #120 | Exceptional $108,161 |
| Europeans | 94.1 /100 | #121 | Exceptional $108,099 |
| Immigrants | Jordan | 92.9 /100 | #122 | Exceptional $107,715 |
Demographics Similar to Immigrants from Africa by Median Family Income
In terms of median family income, the demographic groups most similar to Immigrants from Africa are Immigrants from Cameroon ($100,289, a difference of 0.030%), Samoan ($100,344, a difference of 0.090%), Yugoslavian ($100,119, a difference of 0.14%), Immigrants from South America ($100,414, a difference of 0.16%), and Spanish ($99,977, a difference of 0.28%).
| Demographics | Rating | Rank | Median Family Income |
| Colombians | 27.2 /100 | #191 | Fair $100,750 |
| Immigrants | Kenya | 26.5 /100 | #192 | Fair $100,679 |
| Iraqis | 26.3 /100 | #193 | Fair $100,658 |
| Uruguayans | 26.3 /100 | #194 | Fair $100,656 |
| Immigrants | South America | 23.9 /100 | #195 | Fair $100,414 |
| Samoans | 23.3 /100 | #196 | Fair $100,344 |
| Immigrants | Cameroon | 22.8 /100 | #197 | Fair $100,289 |
| Immigrants | Africa | 22.5 /100 | #198 | Fair $100,256 |
| Yugoslavians | 21.3 /100 | #199 | Fair $100,119 |
| Spanish | 20.1 /100 | #200 | Fair $99,977 |
| Immigrants | Thailand | 19.0 /100 | #201 | Poor $99,840 |
| Whites/Caucasians | 18.7 /100 | #202 | Poor $99,800 |
| Scotch-Irish | 17.1 /100 | #203 | Poor $99,591 |
| Ghanaians | 12.6 /100 | #204 | Poor $98,877 |
| Hawaiians | 12.5 /100 | #205 | Poor $98,869 |