Senegalese vs Yaqui Disability Age 35 to 64
COMPARE
Senegalese
Yaqui
Disability Age 35 to 64
Disability Age 35 to 64 Comparison
Senegalese
Yaqui
12.5%
DISABILITY AGE 35 TO 64
0.5/ 100
METRIC RATING
262nd/ 347
METRIC RANK
13.5%
DISABILITY AGE 35 TO 64
0.0/ 100
METRIC RATING
294th/ 347
METRIC RANK
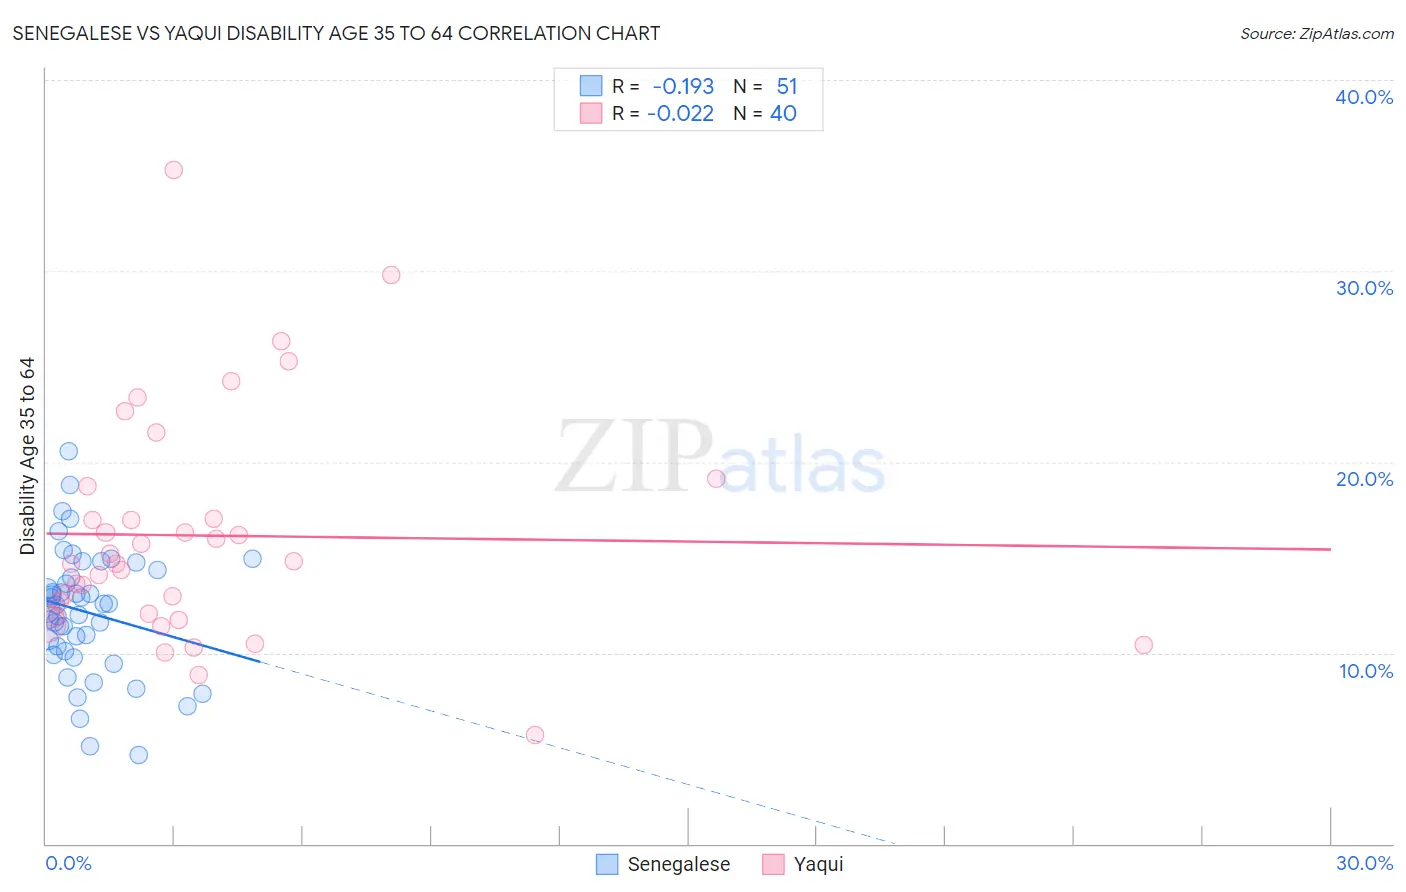
Senegalese vs Yaqui Disability Age 35 to 64 Correlation Chart
The statistical analysis conducted on geographies consisting of 78,098,003 people shows a poor negative correlation between the proportion of Senegalese and percentage of population with a disability between the ages 34 and 64 in the United States with a correlation coefficient (R) of -0.193 and weighted average of 12.5%. Similarly, the statistical analysis conducted on geographies consisting of 107,720,635 people shows no correlation between the proportion of Yaqui and percentage of population with a disability between the ages 34 and 64 in the United States with a correlation coefficient (R) of -0.022 and weighted average of 13.5%, a difference of 7.8%.
Disability Age 35 to 64 Correlation Summary
| Measurement | Senegalese | Yaqui |
| Minimum | 4.6% | 5.7% |
| Maximum | 20.5% | 35.3% |
| Range | 15.9% | 29.6% |
| Mean | 12.1% | 16.1% |
| Median | 12.5% | 14.8% |
| Interquartile 25% (IQ1) | 10.1% | 12.0% |
| Interquartile 75% (IQ3) | 14.3% | 17.9% |
| Interquartile Range (IQR) | 4.2% | 5.9% |
| Standard Deviation (Sample) | 3.3% | 6.0% |
| Standard Deviation (Population) | 3.2% | 5.9% |
Similar Demographics by Disability Age 35 to 64
Demographics Similar to Senegalese by Disability Age 35 to 64
In terms of disability age 35 to 64, the demographic groups most similar to Senegalese are Malaysian (12.5%, a difference of 0.080%), German Russian (12.5%, a difference of 0.23%), Immigrants from Zaire (12.5%, a difference of 0.25%), Immigrants from Portugal (12.5%, a difference of 0.26%), and Marshallese (12.5%, a difference of 0.37%).
| Demographics | Rating | Rank | Disability Age 35 to 64 |
| Japanese | 0.8 /100 | #255 | Tragic 12.3% |
| Scottish | 0.8 /100 | #256 | Tragic 12.4% |
| Mexicans | 0.7 /100 | #257 | Tragic 12.4% |
| Welsh | 0.6 /100 | #258 | Tragic 12.4% |
| English | 0.6 /100 | #259 | Tragic 12.4% |
| German Russians | 0.5 /100 | #260 | Tragic 12.5% |
| Malaysians | 0.5 /100 | #261 | Tragic 12.5% |
| Senegalese | 0.5 /100 | #262 | Tragic 12.5% |
| Immigrants | Zaire | 0.4 /100 | #263 | Tragic 12.5% |
| Immigrants | Portugal | 0.4 /100 | #264 | Tragic 12.5% |
| Marshallese | 0.4 /100 | #265 | Tragic 12.5% |
| Whites/Caucasians | 0.3 /100 | #266 | Tragic 12.6% |
| Sub-Saharan Africans | 0.2 /100 | #267 | Tragic 12.6% |
| Immigrants | Dominica | 0.2 /100 | #268 | Tragic 12.7% |
| Spanish | 0.2 /100 | #269 | Tragic 12.7% |
Demographics Similar to Yaqui by Disability Age 35 to 64
In terms of disability age 35 to 64, the demographic groups most similar to Yaqui are Ute (13.4%, a difference of 0.58%), Yakama (13.6%, a difference of 0.68%), African (13.6%, a difference of 0.90%), Puget Sound Salish (13.3%, a difference of 1.1%), and Immigrants from Congo (13.3%, a difference of 1.1%).
| Demographics | Rating | Rank | Disability Age 35 to 64 |
| Tlingit-Haida | 0.0 /100 | #287 | Tragic 13.2% |
| Fijians | 0.0 /100 | #288 | Tragic 13.2% |
| Indonesians | 0.0 /100 | #289 | Tragic 13.2% |
| Immigrants | Liberia | 0.0 /100 | #290 | Tragic 13.2% |
| Immigrants | Congo | 0.0 /100 | #291 | Tragic 13.3% |
| Puget Sound Salish | 0.0 /100 | #292 | Tragic 13.3% |
| Ute | 0.0 /100 | #293 | Tragic 13.4% |
| Yaqui | 0.0 /100 | #294 | Tragic 13.5% |
| Yakama | 0.0 /100 | #295 | Tragic 13.6% |
| Africans | 0.0 /100 | #296 | Tragic 13.6% |
| Bangladeshis | 0.0 /100 | #297 | Tragic 13.6% |
| Cheyenne | 0.0 /100 | #298 | Tragic 13.6% |
| Spanish Americans | 0.0 /100 | #299 | Tragic 13.7% |
| Delaware | 0.0 /100 | #300 | Tragic 13.7% |
| French American Indians | 0.0 /100 | #301 | Tragic 13.7% |